
Estimating Flared Natural Gas Volumes for Major U.S. Shale Plays Using Satellite Sensor Data
Abstract
Natural gas flaring (“Flaring”) is the controlled disposal of excess natural gas from oil and gas wells, gathering facilities, and refineries into the atmosphere. It is estimated that approximately 140 billion cubic meters of natural gas is flared around the globe, resulting in approximately 300 million tons of CO2 emissions in the atmosphere.1
U.S. state and federal agencies often mandate oil and gas companies to self-report the amount of natural gas that they combust monthly (“Reported Flare Volumes”). These same agencies set limitations on the total amount of natural gas that can be flared. Reported Flare Volumes are used by U.S. regulatory bodies to monitor these U.S. greenhouse gas emissions and administer environmental policy. In addition, this data is used by global midstream pipeline companies and investors to identify where gaps in natural gas collection infrastructure exist.
However, studies suggest that these Reported Flare Volumes fail to capture precise flared volumes in a timely fashion.2 To understand the full extent of domestic emissions within the atmosphere and whether infrastructure shortfalls exist, it is crucial to utilize all available tools and methodologies.
By leveraging publicly available satellite sensor data, the methodology noted within this analysis discusses quantifying flared natural gas volumes at flare stacks and pipes of producing oil and gas wells (“Estimated Flare Volumes”) as an alternative to state-government reported sources (i.e. Reported Flare Volumes). For this study, satellite sensor data is sourced from the National Oceanic and Atmospheric Administration’s (“NOAA”) Visible Infrared Imaging Radiometer Suite (“VIIRS”), synthesized with oil and gas production and well-meta datasets, and then is processed using regression-based statistical models to estimate flared gas volumes. Aggregated Reported Flared Volumes and derivative Estimated Flared Volumes are collected for select U.S. basin and shale plays such as the Permian, Eagle Ford, Denver Julesburg – Niobrara (Colorado only) and Bakken (North Dakota only) (“Tracked Regions”).
For the Tracked Regions, Reported and Estimated Flare Volumes were 257 / 253 Bcf in FY 2020, reflecting a 48 / 43% drop from the FY 2019 volumes of 489 / 447 Bcf, respectively. On a CO2 equivalent (“CO2e”) basis, natural gas emissions for Tracked Regions, Reported Flaring Volume CO2e were 14 Megatons (“Mt”) and 27 Mt for FY 2020 and FY 2019, respectively.14 The Permian basin and Bakken shale play were identified as the regions with the highest Reported Flaring Volumes over the FY 2019 and FY 2020 periods. Operators were also ranked by total produced volumes and their proportion of Reported Flare Volumes to total Gas Produced (“Flared Percentages”). For the FY 2019 and FY 2020 periods, Occidental Petroleum (NYSE: OXY), EOG Resources (NYSE: EOG), ConocoPhillips (NYSE: COP), and ExxonMobil (NYSE: XOM) were the top Tracked Region Operators who had the highest Produced Volumes while maintaining the low Flared Percentages (<5%).
The methodologies outlined offer a systematic and objective means of monitoring flaring activity and have the potential to be transferred in other hydrocarbon-producing regions across the world. By analyzing both Reported Flare Volume and derivative Estimate Flare Volume datasets, corporations, governments, and communities can better understand emission levels on a holistic, near real-time basis and more quickly identify where new collection and pipeline infrastructure is required.
Introduction
Natural gas flaring (“Flaring”) is the controlled disposal of excess natural gas from oil and gas wells, gathering facilities, and refineries into the atmosphere. The reasons for Flaring include safety and management of excess gas volumes that cannot be efficiently and economically stored or processed by existing midstream infrastructure. A 2015 World Bank Report estimated that approximately 140 billion cubic meters of natural gas is flared around the globe, resulting in approximately 300 million tons of CO2 emissions in the atmosphere.1
U.S. state and federal agencies often mandate oil and gas companies to self-report the amount of natural gas that they flare monthly (“Reported Flare Volumes”). These same agencies set limitations on the total amount of natural gas that can be flared. Reported Flare Volumes are used by U.S. regulatory bodies to monitor these U.S. greenhouse gas emissions and administer environmental policy. However, studies suggest that these Reported Flare Volumes fail to capture precise flared volumes in a timely fashion.2
To understand the full extent of domestic emissions within the atmosphere and whether they comply with federal and state-specific limitations, it is important to leverage all available tools and methodologies. An attractive option for monitoring natural gas flares is by estimating the quantity of flared natural gas at individual flare stacks and pipes of producing oil and gas wells (“Estimated Flare Volumes”) using infrared signals captured by the National Oceanic and Atmospheric Administration’s (“NOAA”) Visible Infrared Imaging Radiometer Suite (“VIIRS”).3,4 By synthesizing satellite-sensor data with oil and gas production and well-meta datasets and Reported Flare Volumes, quantifying site-specific estimations of natural gas flare volumes is achievable in a near-real time and systematic fashion.
Methodology
Overview
Radiant heat (“RH”) measurements from satellite infrared sensors have demonstrated a direct correlation with natural gas flaring volumes, up to an accuracy of ±9.5%.3,4 VIIRS instruments on the NOAA’s Joint Polar Satellite System (“JPSS”) and Suomi National Polar-Orbiting Partnership (“NPP”) detect and measure radiant emissions from natural gas flares through the collection of shortwave and near-infrared data at night.8 As part of this collection, these instruments record daily peak radiant emissions from these flares at a moderate resolution. A processed and published version of this data is called the VIIRS Nightfire (“VNF”) algorithm. This VNF dataset contains geotagged global radiant heat measurements and other relevant meta data (e.g. flare temperature, area of observed flame and radiant heat intensity, etc.) and is published daily by the Colorado School of Mines.3,5 The VNF algorithm uses the Wien’s Displacement and Stefan-Boltzmann laws to calculate important attributes such as flaring source temperatures and their associated radiant heats.
Aggregated Reported Flared Volumes are collected, and derivative Estimated Flared Volumes are calculated for select U.S. shale plays and basins including: the Permian basin (“Permian”), Eagle Ford shale play (“Eagle Ford”), Denver Julesburg basin – Niobrara – Colorado (“DJ Basin”), and Bakken shale play - North Dakota (“Bakken”), (collectively, “Tracked Regions”).
To develop Estimated Flare Volumes using infrared measurements, VNF data is first proximally matched to associated oil and gas production and well meta data within the U.S.
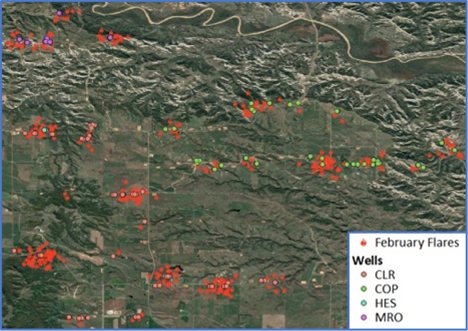
To improve the resolution of VNF detected flares, geotagged satellite flare observations are geospatially matched to clusters of hydrocarbon producing oil and gas wells with a radius of 415 meters. The assumption is that nearby aggregated groups of wells and well pads have a higher probability of flaring from the same source (vs. disparate sources). Flare clusters are then assigned to the nearest well clusters and their corresponding RH values are aggregated by reported operator (See Figure 1).
Figure 1. North Dakota FLARE CLUSTER Well AsSignments (February
2020)
Statistical regression-based methods are then used to convert aggregated flare cluster radiant heat measurements into Estimated Flaring Volumes.
First, a linear regression
model is used to link flare cluster radiant heat measurements to their
associated Reported Flaring Volumes. The model’s purpose is to calculate
operator / basin-specific Conversion Factors (![]() ) that directly link flare
cluster radiant heat measurements to Reported Flare Volumes.
) that directly link flare
cluster radiant heat measurements to Reported Flare Volumes.
The model is then optimized to minimize the root mean square error (“RMSE”) for these Conversion Factors. Individual statistical models are trained for each basin, shale play, and company-basin/shale play combination to account for unique features in reporting patterns, acreages, atmospheric conditions, flaring protocols and well-pad surface infrastructure.
These calculated Conversion Factors are then used to forecast Estimated Flaring Volumes for the Tracked Regions and the operators within Tracked Regions by multiplying Conversion Factors to geotagged VNF radiant heat measurements (see Detailed Methodology (4)). Natural gas flaring volumes on a CO2 equivalent (“CO2e”) basis is calculated by multiplying the Estimated Flaring Volume with a standard conversion factor published by Environment Protection Agency (EPA)14.
This process is repeated daily as new VIIRS data is published and allows for near-real time Estimated Flaring Volumes forecasts to be generated.
Source code and data for this process is available under the LGPL open source license in the Github Repository for Flaring Monitor.
Detailed Methodology
Theory
Raw short-wave and near-infrared measurements collected by VIIRS instruments are processed using the Nightfire algorithm. The Nightfire algorithm uses six spectral bands to detect and characterize sub-pixel infrared emitters. Using the flare radiances in these spectral bands, heat source temperatures are calculated using Wien’s Displacement Law (1):
where ![]() is
the heat source temperature in kelvin (K),
is
the heat source temperature in kelvin (K), ![]() is
the Wien’s displacement constant = 2897.8
is
the Wien’s displacement constant = 2897.8 ![]() and
and ![]() is the wavelength of peak
radiant emissions (e.g. flare sources).
is the wavelength of peak
radiant emissions (e.g. flare sources).
Using the flare source temperature (T)(1), radiant heat (RH) is calculated using the Stefan-Boltzmann law (2):
where ![]() is radiant heat in megawatts
(MW),
is radiant heat in megawatts
(MW), ![]() is the Stefan-Boltzmann
constant, S is the source area in square meters (m2), and
is the Stefan-Boltzmann
constant, S is the source area in square meters (m2), and ![]() is the
temperature of heat source in kelvin (K).
is the
temperature of heat source in kelvin (K).
Radiant heat measurements have been found to have a direct correlation with natural gas flaring volumes3, up to an accuracy of ±9.5%4 as shown in (3) and (4),
where V is the natural gas
flaring volume in billion cubic feet (Bcf), ![]() is a conversion factor in Bcf
per MW, and RH is radiant heat in megawatts (MW).
is a conversion factor in Bcf
per MW, and RH is radiant heat in megawatts (MW).
By using time-stamped radiant
heat and temperature measurements of identified source areas, this methodology calculates
a specific conversion factor (either basin or shale play-level or Operator-level),
![]() , by benchmarking
calculated volumes (V) to their associated, publicly reported natural gas flaring
volumes from regulatory sources.
, by benchmarking
calculated volumes (V) to their associated, publicly reported natural gas flaring
volumes from regulatory sources.
Using these conversion factors, operator and basin-specific Flaring volumes are calculated for Tracked Regions using radiant heat and temperature measurements available from the Nightfire algorithm, often prior to publishing of Reported Flaring Volumes by regulatory agencies.
Processing
These next sections discuss the steps necessary to recreate the methodology in an independent computational environment utilizing VNF Data and Reported Flare Volumes.
VNF Data Processing
VNF data is published by the Colorado School of Mines Earth Observation Group4, and the following steps are performed to the data set (collectively, “VNF Data”):
1. VNF data series used in this analysis include:
a. Date_LTZ (“Date-Time”): Observed Flare pixel date-time
b. Lat_GMTCO (“Flare Latitude”): Flare pixel latitude
c. Lon_GMTCO (“Flare Longitude”): Flare pixel longitude
d. Temp_BB (“Temperature”): Flare source temperature assuming blackbody source (derived using Nightfire algorithm (1))
e. RH (“Radiant Heat”): Flare source radiant heat (derived using Nightfire algorithm (2))
2. Using Flare Latitude and Flare Longitude coordinates, a VNF dataset is filtered to only include observed satellite measurements within Tracked Regions.
a. Outlines of the Tracked Regions are sourced from the U.S. Energy Information Administration (“EIA”) Basin and Shale play shapefiles.6
3. Observations with Temperatures less than 1,400 K are then removed from the sample set.
a. This is done to remove noise from non-Flaring sources like forest fires and biomass, which typically burn at temperatures less than 1,400 K (vs. Flaring sources which burn at over 1,400 K).4
4. Remaining observations are then binned on the calendar week for which they were detected using Date-Time.
5. Once binned by week, observations within a 150-meter flare-to-flare distance radius are clustered together (“Flare Clusters”).
a. A 150-meter threshold flare-to-flare distance limit was determined by iteratively testing various cluster distance limits across Tracked Regions.
b. To calculate this radius, various lengths were tested and the threshold distance limit was chosen by identifying the radius with the highest average correlation of monthly aggregated Radiant Heat and monthly Reported Flare Volume for all operators.
c. The threshold distance helps account for the decreased precision of detecting repeated flares. The NOAA’s satellite resolution is limited to 750 meters and the threshold distance provides a limit on a flare cluster size to account for operators having adjacent acreage positions and idiosyncratic well pad orientations.
6. Once the Flare Clusters are created, Radiant Heat values associated with each Flare Cluster are summed together to calculate total Radiant Heat of individual Flare Clusters (“Total RH”).
Well Data Processing
Publicly available, state-reported oil and gas production and meta data are aggregated and the following steps are performed9:
1. State-reported oil and gas production and meta data required for this analysis include (collectively, “Well Data”):
a. Meta data:
i. API: Unique Identifier given to every permitted Oil and Gas Well in the U.S.
ii. Operator Name (“Operator”): Name of the current operator of an oil and gas well held on record with the relevant U.S. state regulatory agency
iii. Latitude Surface Hole (“Well Latitude”): Standardized NAD83/NAD 27 Latitude metric for the Surface Hole location of a wellbore
iv. Longitude Surface Hole (“Well Longitude”): Standardized NAD83/NAD27 Longitude metric for the Surface Hole location of a wellbore
b. Production data:
i. Month of Production (“Production Month”): Month for which the hydrocarbon production is reported
ii. Oil Volume Produced (“Produced Oil”): Monthly oil production reported by the state regulatory agency for a particular API or lease
iii. Gas Volume Produced (“Produced Gas”): Monthly gas production reported by the state regulatory agency for a particular API or lease
iv. Gas Volume Flared (“Reported Flare Volumes”): Monthly gas flared reported by the state regulatory agency for a particular API or lease
2. Using Well Latitude and Well Longitude coordinates, Well Data is filtered to only include measurements within Tracked Regions.
3. APIs or Leases with no Produced Oil or Produced Gas in the last 6 months are then filtered out of the Well Data subset.
a. This step helps to eliminate all wells that are either shut-in or temporality abandoned.
4. The remaining well subset is then binned by Production Month and then by Operator
5. Binned Reported Flare Volumes are then clustered using a 300-meter distance limit between wells (“Well Clusters”).
a. This clustering step helps account for multiple wells being collocated on the same well pad or proximally positioned next to other pads utilizing communal flare stacks.
b. The 300-meter distance limit was derived by averaging a large sample set of oilfield distances including: adjacent pads distances, well to flare stack distances, and well to common tank battery distances. These distances were measured using high-resolution satellite imagery across our Tracked Regions.7
Regression Analysis
Processed VNF and Well Data subsets are then synthesized and modeled in the steps below:
1. For a calendar month, Flare Clusters are assigned to the nearest Well Clusters with a maximum geospatial distance of 415 meters.
2. Flare Cluster Total RH values are then tagged to their associated Well Clusters (“Well Cluster RH”).
a. Each Well Cluster can have zero, one, or multiple Flare Clusters associated with them in any given month.
3. Well Cluster RHs are then binned by each basin, shale play, and Operator-basin/shale play combination within Tracked Regions (“Aggregated Well Cluster RH”).
4. Conversion
factors (![]() are then calculated for each
basin, shale play, and Operator-basin/shale play combination within Tracked
Regions.
are then calculated for each
basin, shale play, and Operator-basin/shale play combination within Tracked
Regions.
a. A linear regression model is utilized, setting Reported Flare Volumes as the Y variable and Aggregated Well Cluster RH values as the X variable, as shown in (6).
b.
Root
mean square error optimizations are executed (6) to calculate basin, shale
play, and Operator-specific conversion factors, ![]()
5. These
calculated conversion factors, ![]() are then applied to Aggregated
Well Cluster RHs to calculate Estimated Flare Volumes using Equation (5), as
new Aggregated Well Cluster RHs are made available.
are then applied to Aggregated
Well Cluster RHs to calculate Estimated Flare Volumes using Equation (5), as
new Aggregated Well Cluster RHs are made available.
6. To calculate the upper and lower estimate bounds for Estimated Flare volumes, absolute percentage errors between historical Reported Flare Volumes and Estimated Flare Volumes are averaged over all calendar months for which Operator-level Reported Flare Volumes data are available.
7. CO2 equivalent (“CO2e”) emission quantities are derived by multiplying the Flaring Volume with a standard conversion factor published by the Environment Protection Agency (EPA) as shown in Equation (7).14

Discussion
Reported Flare Volumes and Estimated Flare Volumes were analyzed on a geographic and Operator-level for the Tracked Regions for the following periods: January 1, 2019 to December 31, 2019 (“FY 2019”) and January 1, 2020 to December 31, 2020 (“FY 2020”).
Tracked Regions
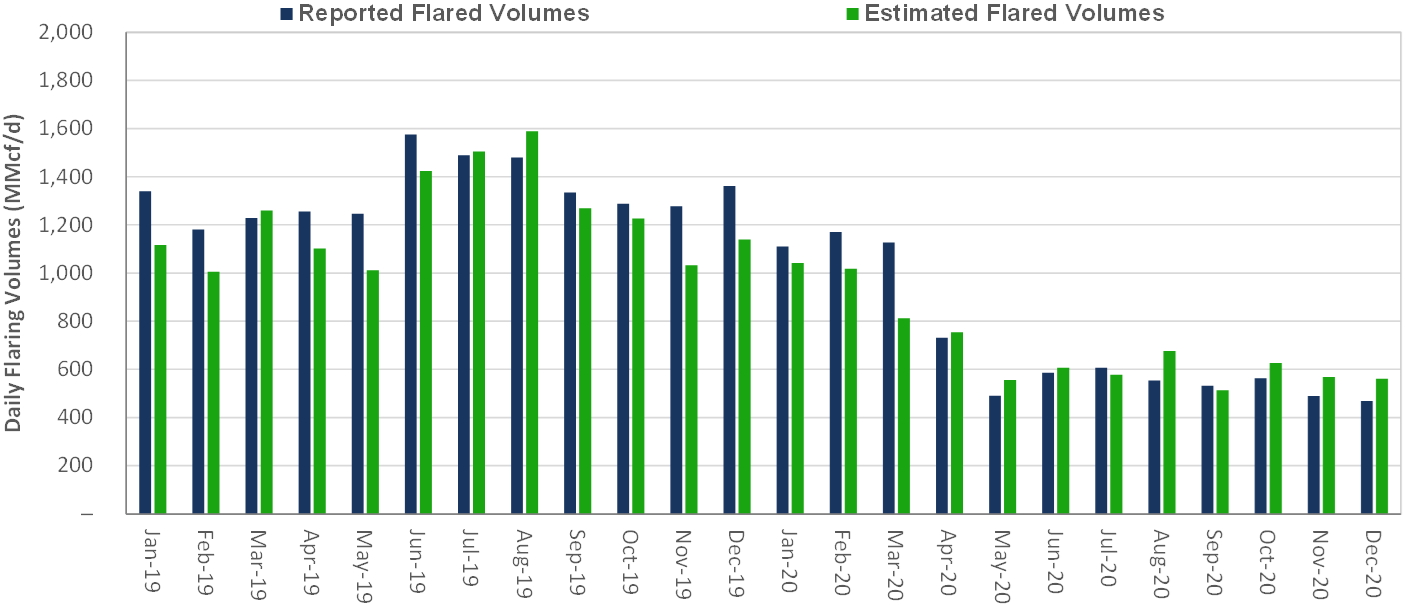
For the Tracked Regions, Reported and Estimated Flare Volumes were 257 / 253 Bcf in FY 2020, reflecting a 48 / 43% drop from the FY 2019 volumes of 489 / 447 Bcf, respectively (see Table 1 and Figure 2). On a CO2e basis, Tracked Region Reported Flaring Volumes were 14 Mt in FY 2020 and 27 Mt in FY 2019.
Within the FY 2019 and FY 2020 periods, peak Reported Flare Volumes and Estimated Flare Volumes were observed in June 2019 and August 2019, at 47 Bcf and 49 Bcf, respectively, representing ~5.3% of total Produced Gas in the region for the months (see Table 1). For the FY 2019 and FY 2020 periods, Reported Flare Volumes reflected, 4.5% and 2.3%, of total Produced Gas, representing a 49% decrease year over year.
table
1. tracked region Daily Flaring Volumes (Reported vs. Estimated Flaring)
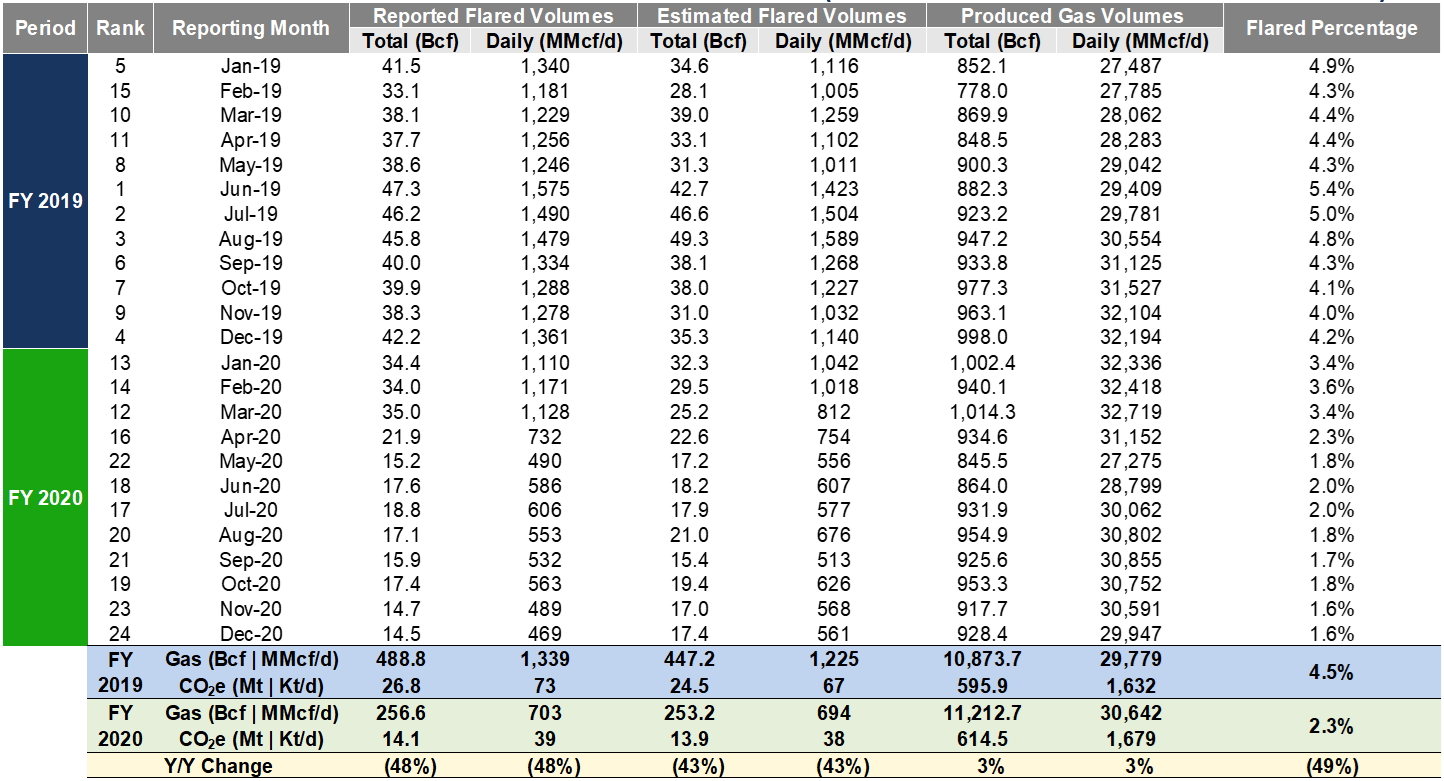
Figure 2. TRACKED Daily Flaring Volumes
(Reported vs. Estimated Flaring)
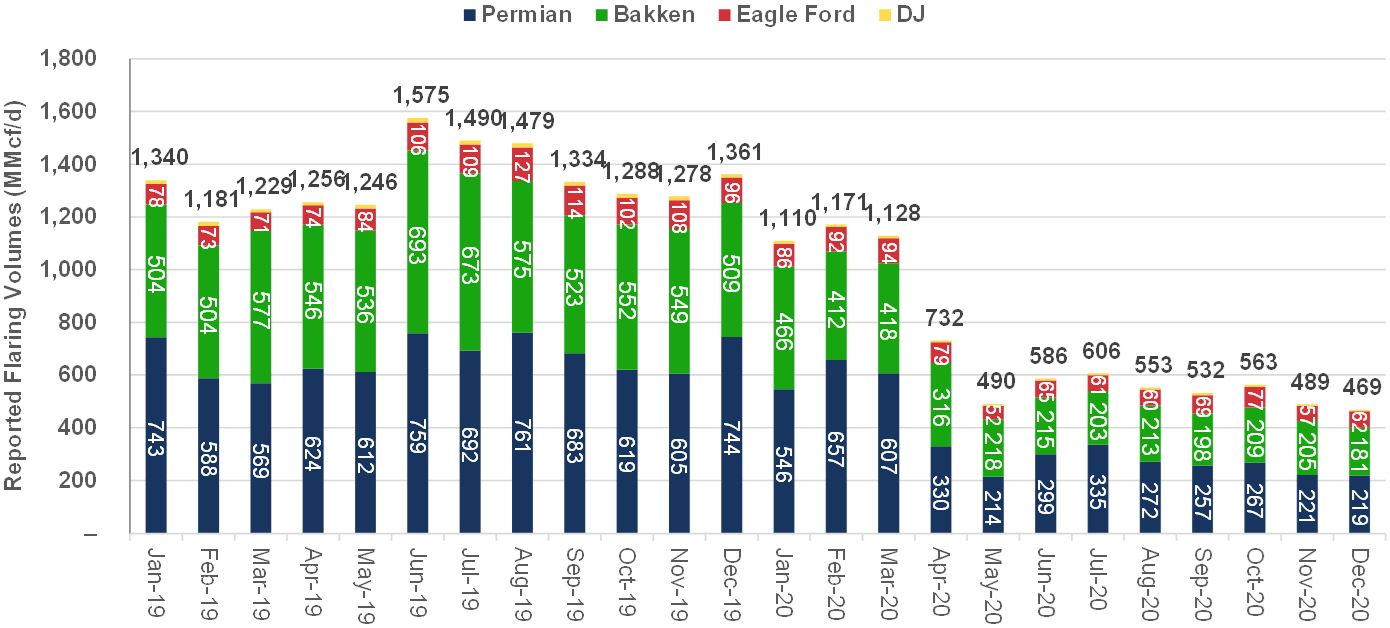
The constituent areas of Tracked Regions were benchmarked by their absolute Reported Flare Volume for the FY 2019 and FY 2020 periods (see Table 2 and Figure 3). The Permian had the highest average Reported Flare Volumes in FY 2019 and FY 2020 of 667 MMcf/d and 352 MMcf/d, respectively. The Bakken had the second highest average Reported Flare Volumes of 562 MMcf/d and 272 MMcf/d, in FY 2019 and FY 2020, respectively. The Eagle Ford had the smallest year over year change (25%) in Reported Flare Volumes between the FY 2019 and FY 2020 periods, while the Bakken had the largest drop of 52%.
table 2. tracked region breakout by AREA - reported Flaring Volumes
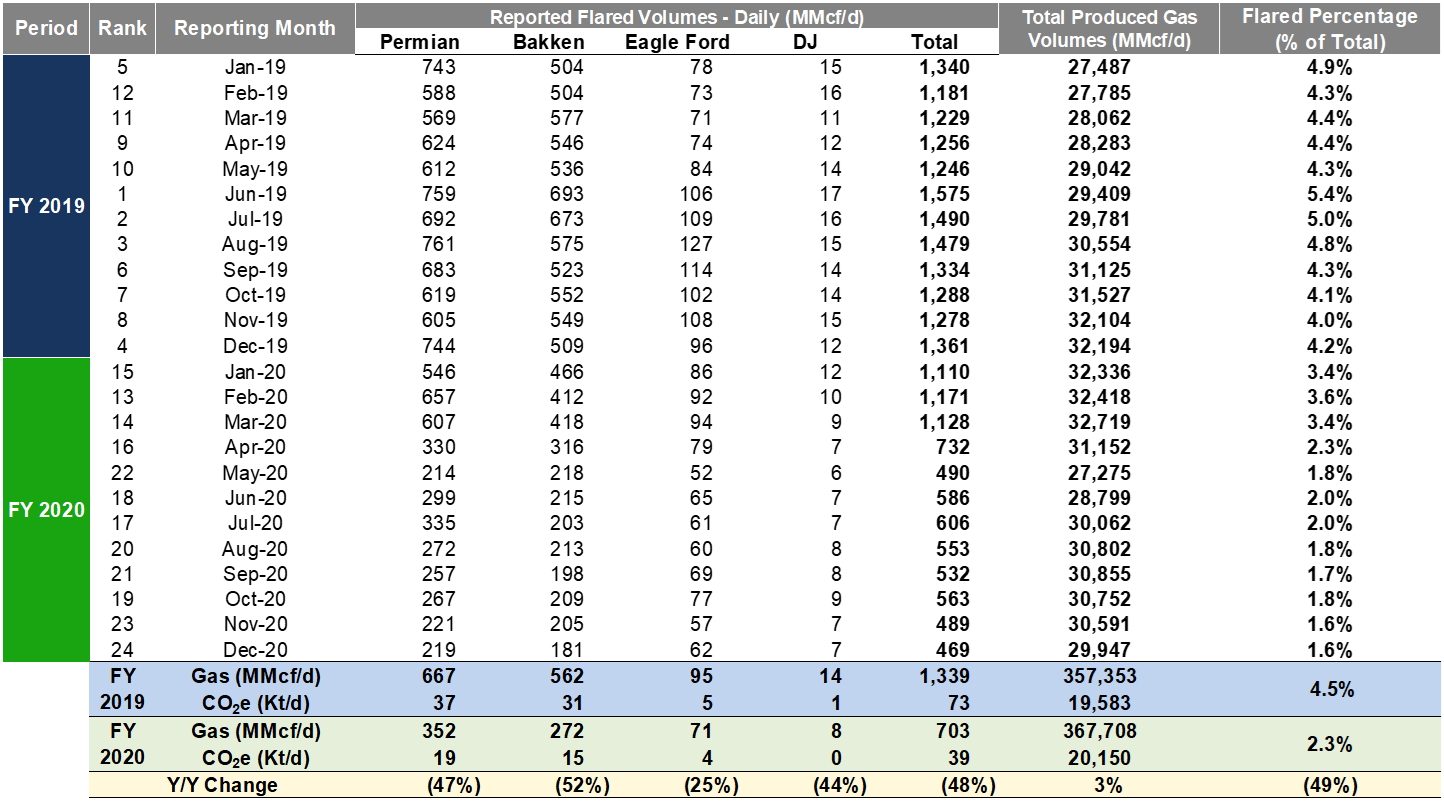
Figure 3. tracked
region breakout by AREA - reported Flaring Volumes
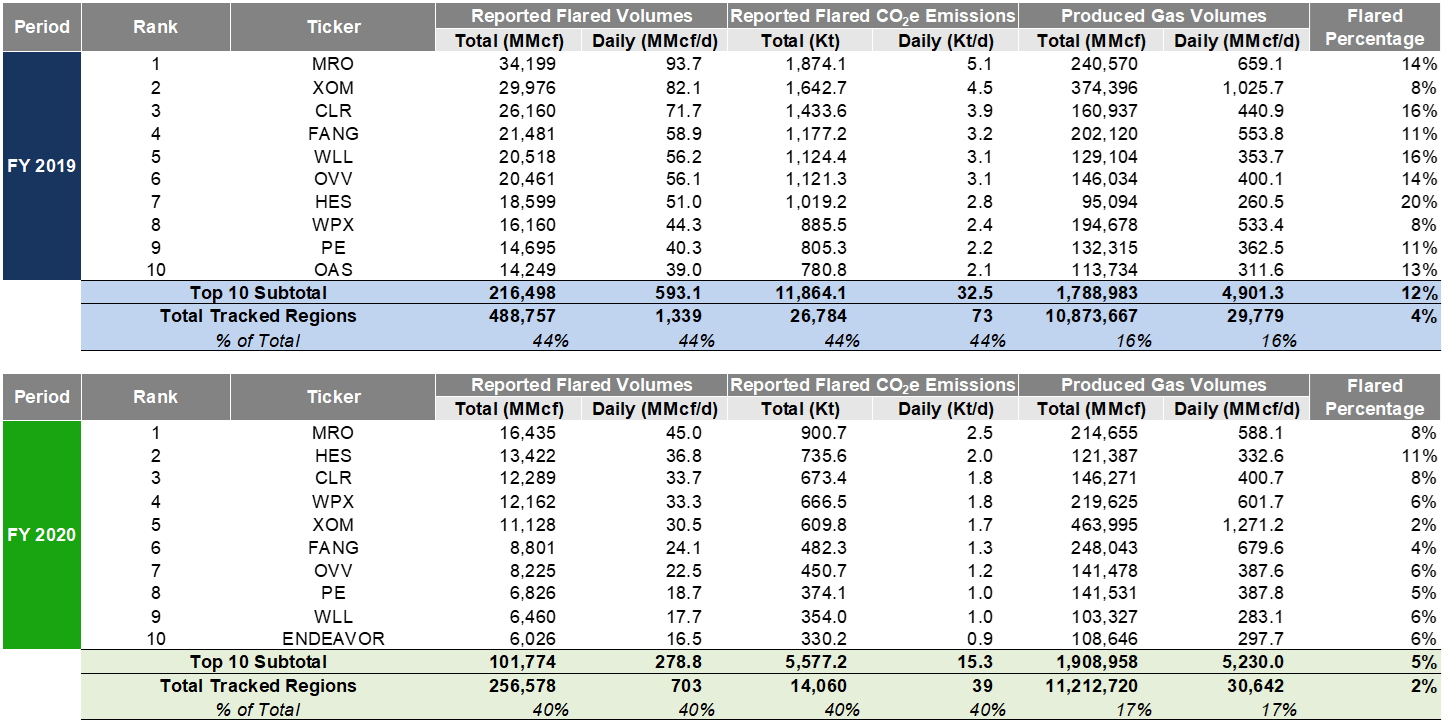
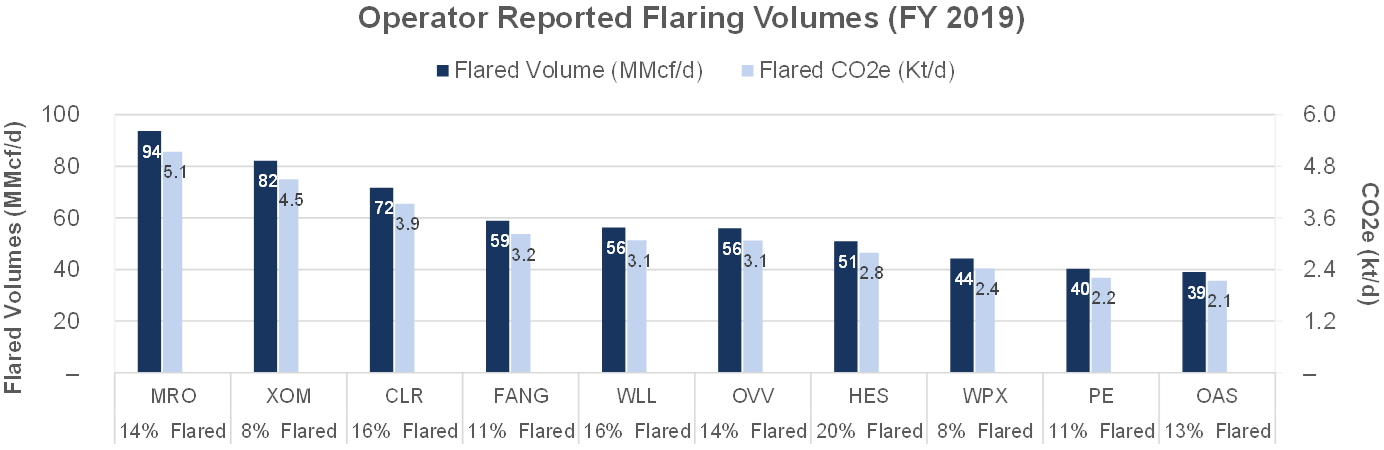
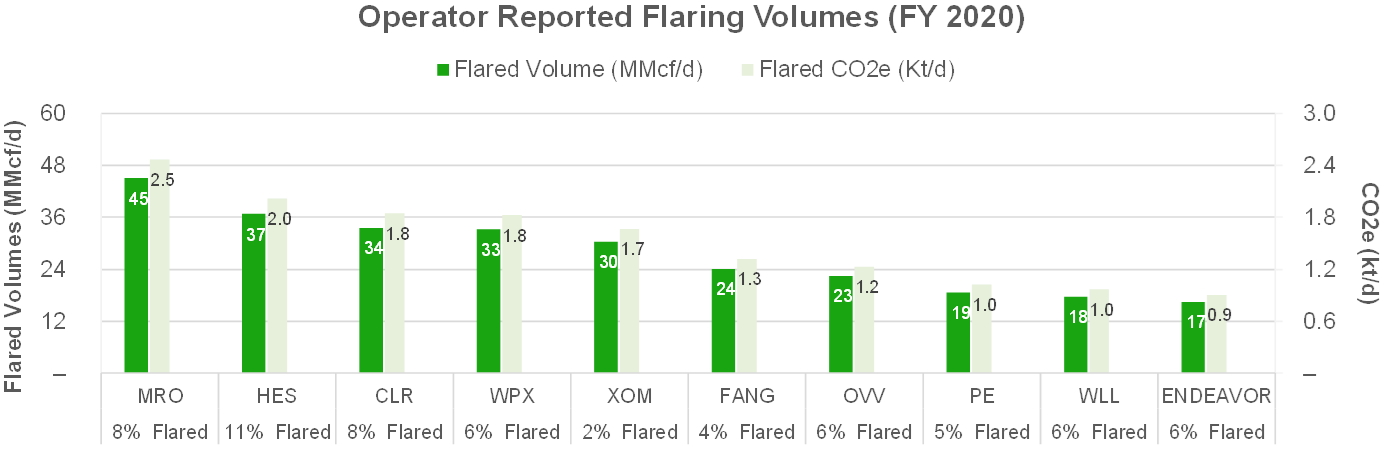
For Tracked Regions, Operators were ranked by their absolute Reported Flare Volumes for the FY 2019 and FY 2020 periods (See Table 3, Figures 4 and 5). Marathon Oil (NYSE: MRO) had the highest average Reported Flare Volumes in FY 2019 and FY 2020 of 94 MMcf/d and 45 MMcf/d, respectively. Oasis Petroleum (NYSE: OAS) was among the top Tracked Region “flarers” by Reported Flare Volumes for the FY 2019 period but was replaced by Endeavor Energy Resources, LP (“Endeavor”) for the FY 2020 period. The Top 10 Operators by Reported Flare Volumes comprised 44% of the total FY 2019 Tracked Region Flare Volumes and 40% of the FY 2020 volumes, while accounting for 16 – 17% of the total Produced Gas Volumes.
table 3. tracked
Region Operators Ranked by reported flared volume (FY 2019 and FY 2020)
Figures 4 and 5. Tracked REgion Operators Ranked by reported flare volume
Within Tracked Regions, Operators were also ranked by their absolute Flared Percentage for the FY 2019 and FY 2020 periods (See Table 4). Gulfport Energy (NYSE: GPOR) and Sandridge (NYSE:SD) had the highest proportion of Reported Flare Volumes to total Gas Produced (“Flared Percentage”) within the Tracked Region in FY 2019 and FY 2020 at 89% and 100%, respectively. (See Tables 4 and 5).
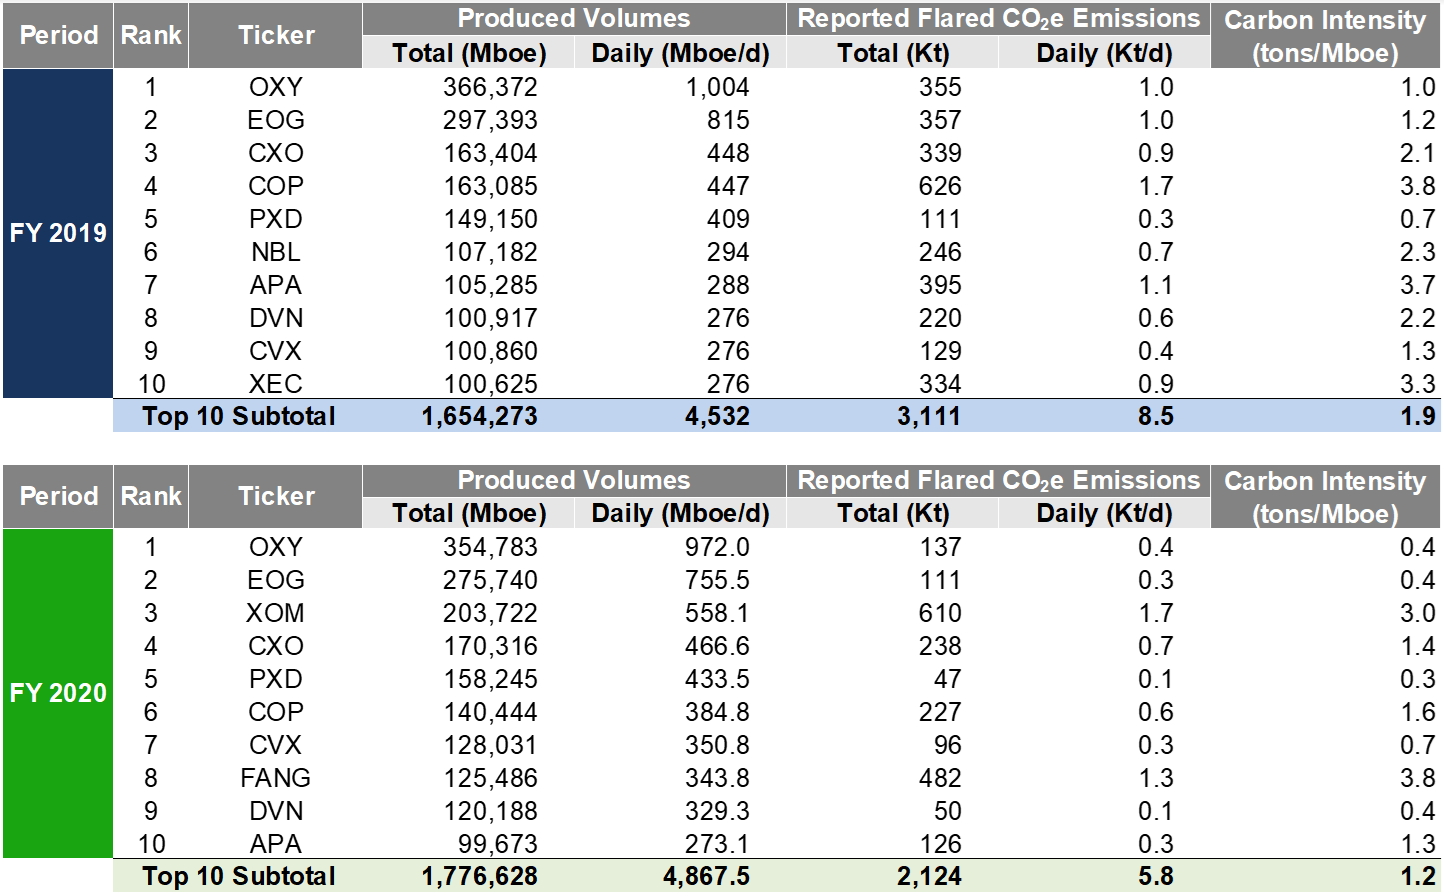
Tracked Region Operators who realized a Flared Percentage of less than 5% were also ranked by their total Produced Volumes (MMcfe). For the FY 2019 and FY 2020 periods, Occidental Petroleum (NYSE: OXY), EOG Resources (NYSE: EOG), ConocoPhillips (NYSE: COP), and ExxonMobil (NYSE: XOM) had the highest Produced Volumes while maintaining low Flared Percentages (see Tables 6 and 7).
table 4. Tracked
Region Operators Ranked by flared percentage
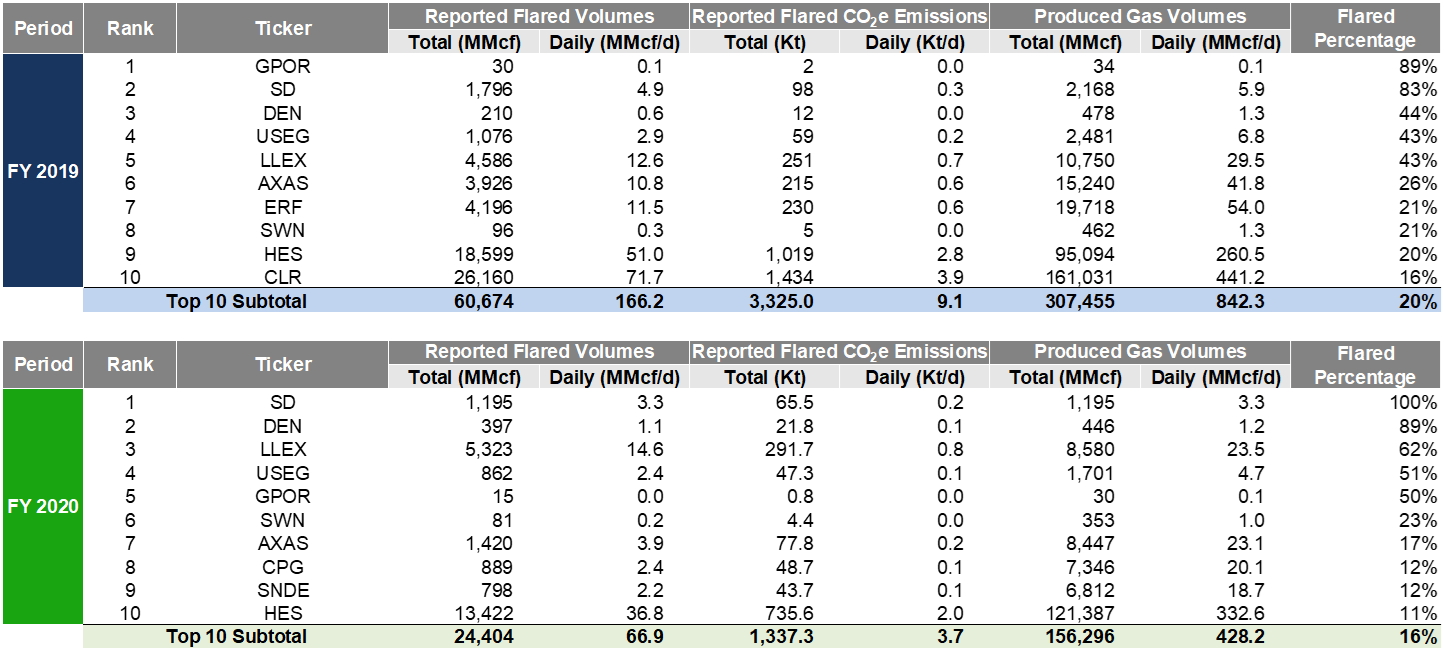
TABLE 5. TRACKED REGION OPERATORS RANKED BY FLARED PERCENTAGE - FLARING CO2e METRICS
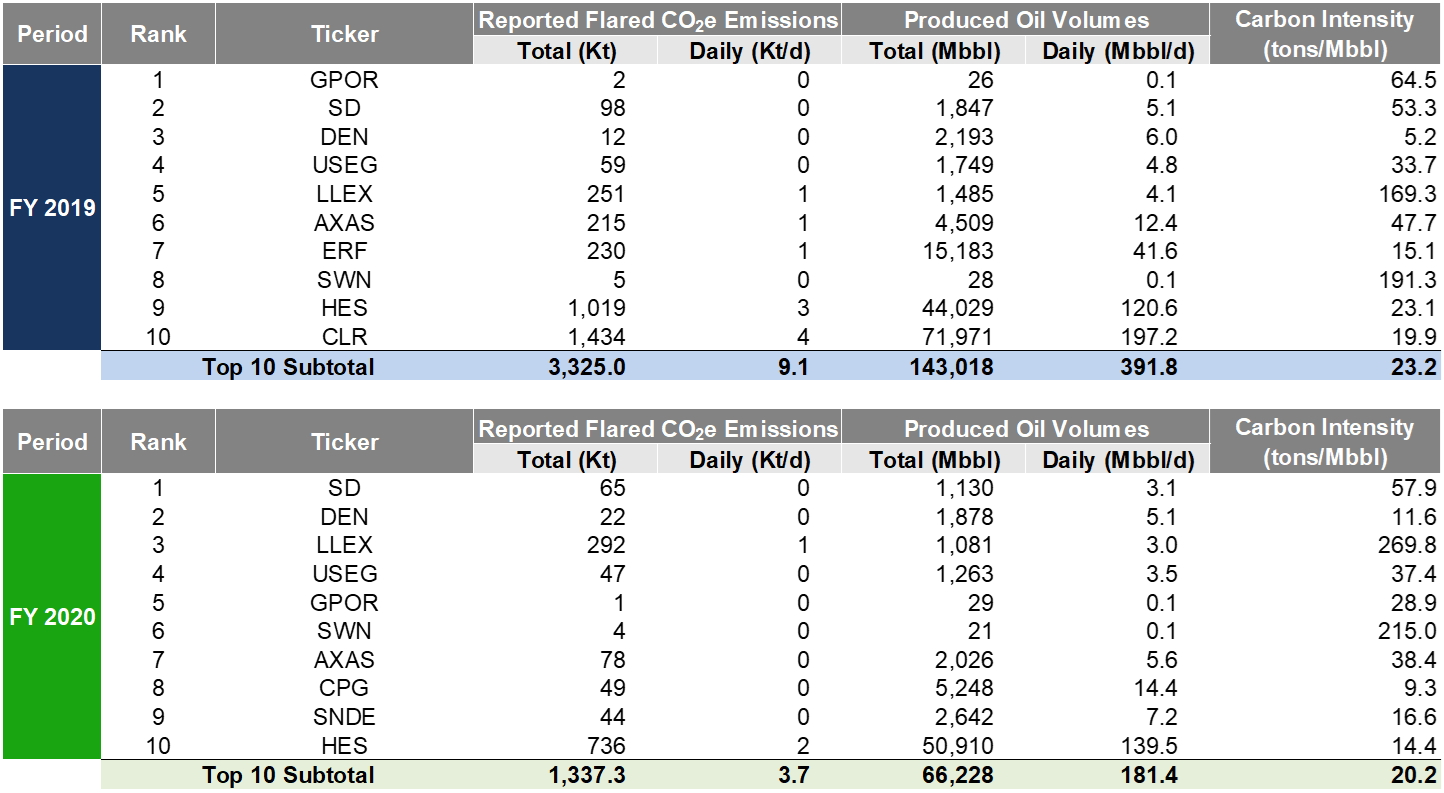
TABLE 6. TRACKED REGION HIGHEST PRODUCING OPERATORS WITH LOW FLARED PERCENTAGES (<5%)
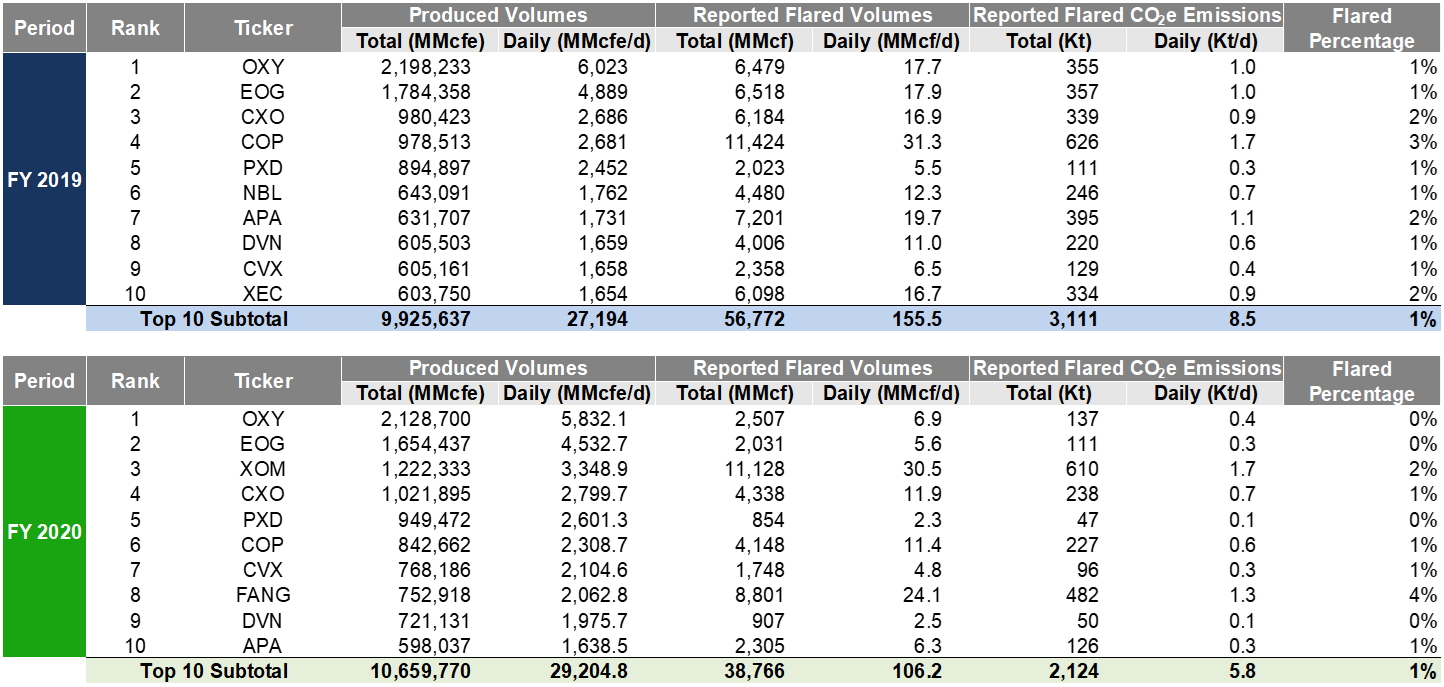
TABLE 7. TRACKED REGION HIGHEST PRODUCING OPERATORS WITH LOW FLARED PERCENTAGES (<5%) – FLARING CO2e METRICS
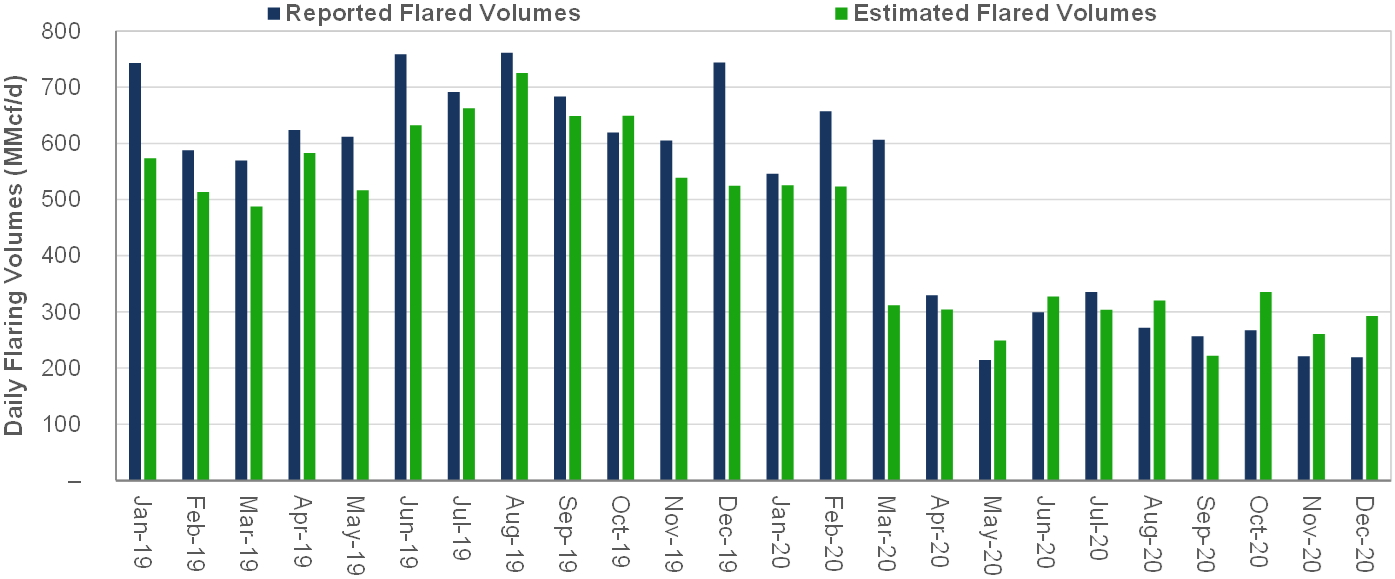
Permian
In the Permian, Reported and Estimated Flare Volumes were 129 / 121 Bcf in FY 2020, reflecting a 47 / 44% drop from the FY 2019 volumes of 244 / 215 Bcf, respectively (see Table 8 and Figure 6). On a CO2e basis, Permian Reported Flaring Volumes were 7 Mt in FY 2020 and 13 Mt in FY 2019.
Within the FY 2019 and FY 2020 periods, peak Reported Flare Volumes and Estimated Flare Volumes were observed in August 2019, at 24 Bcf and 23 Bcf, respectively, representing ~5% of total Produced Gas in the region for the month (see Table 8). For the FY 2019 and FY 2020 periods, Reported Flare Volumes comprised, 4% and 2%, of total Produced Gas.
table 8. Permian
Daily Flaring Volumes (Reported vs. Estimated Flaring)

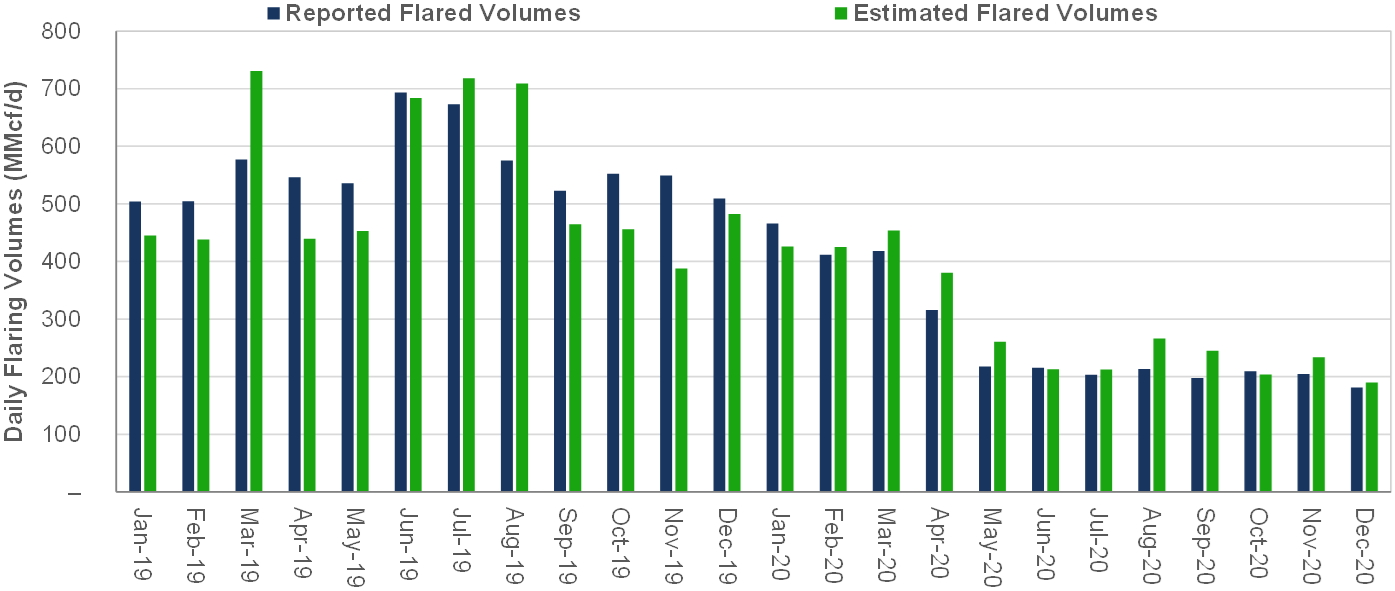
Figure 6. permian
Daily Flaring Volumes (Reported vs. Estimated Flaring)
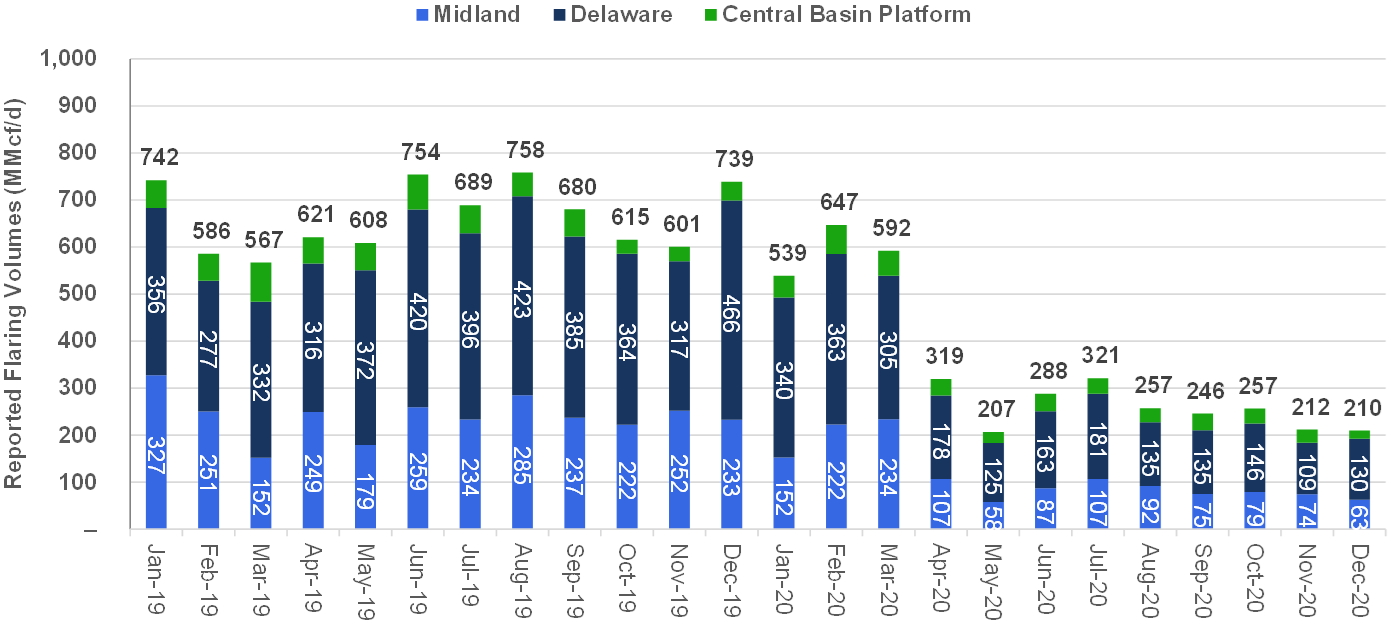
Within the Permian, sub-basins were benchmarked by their absolute Reported Flare Volumes for the FY 2019 and FY 2020 periods (see Table 9 and Figure 7). The Delaware sub-basin had the highest average daily Reported Flare Volume in FY 2019 and FY 2020 of 370 MMcf/d and 193 MMcf/d, respectively. The Midland sub-basin had the second highest average daily Reported Flare Volumes of 240 MMcf/d and 113 MMcf/d in FY 2019 and FY 2020, respectively.
table 9. permian
Sub-Basin Daily Flaring Volumes (Reported vs. Estimated Flaring)
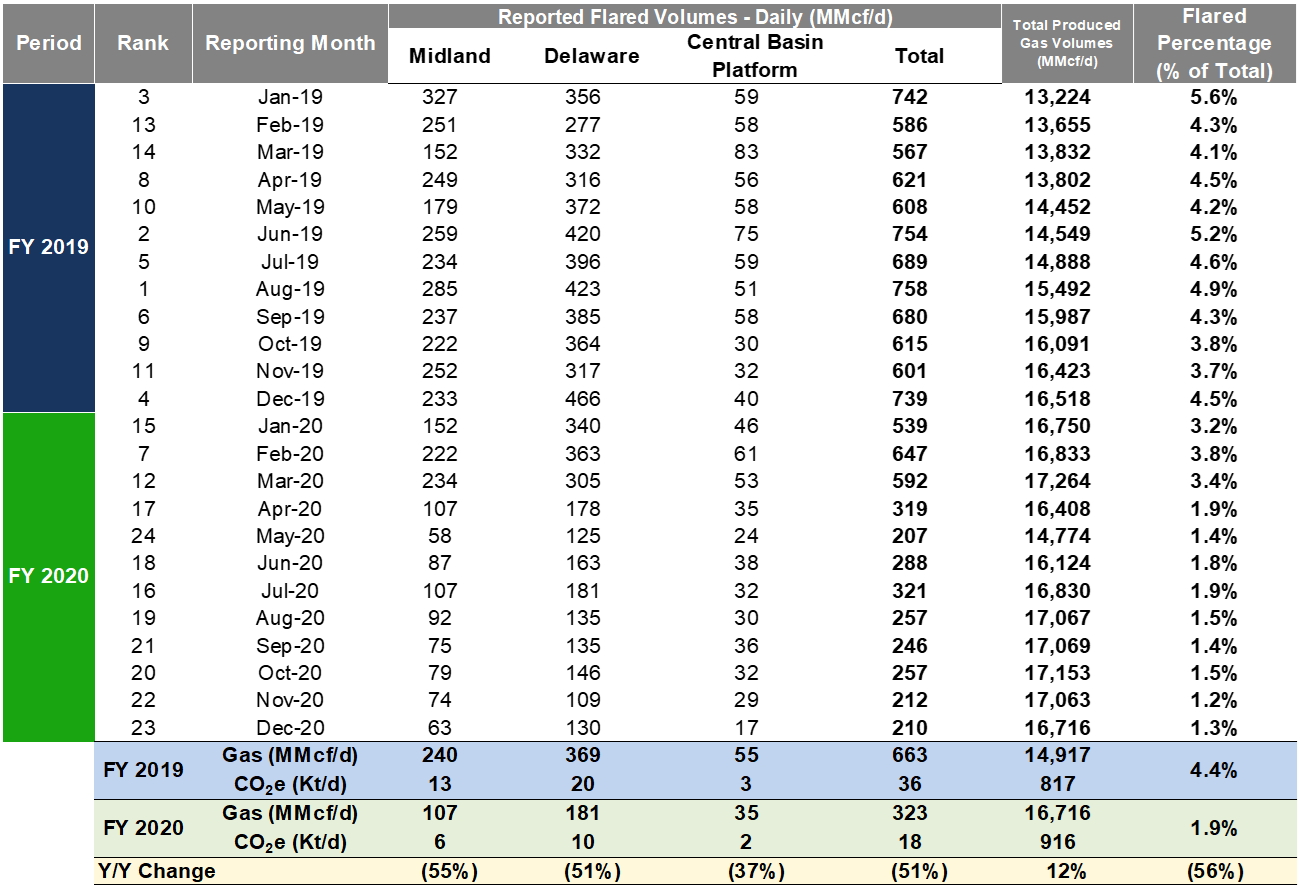
figure 7. permian Sub-Basin Daily Flaring Volumes (Reported vs.
Estimated Flaring)
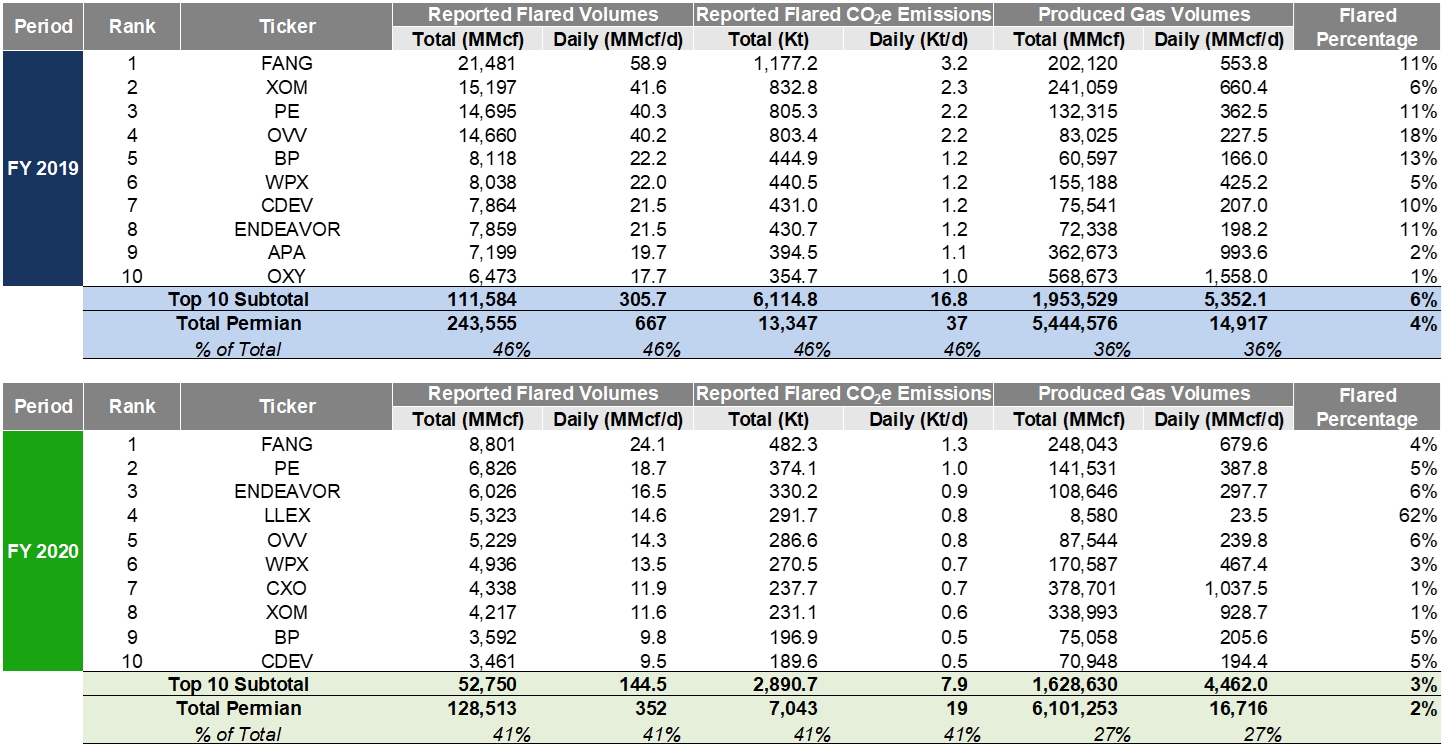
Within the Permian, Operators were ranked by their absolute Reported Flare Volumes for the FY 2019 and FY 2020 periods (See Table 10 and Figures 8 and 9). Diamondback Energy (NYSE: FANG) had the highest average daily Reported Flare Volumes in FY 2019 and FY 2020 of 59 MMcf/d and 24 MMcf/d, respectively. Apache Corp (NYSE: APA) and Occidental Petroleum (NYSE: OXY) were among the top “flarers” by Reported Flare Volumes for the FY 2019 period but were replaced by Lilis Energy (NYSE: LLEX) and Concho Resources (NYSE: CXO) for the FY 2020 period. The Top 10 Operators by Reported Flare Volumes accounted for 46% of the total FY 2019 Permian Flare Volumes and 41% of the FY 2020 volumes.
table 10. Permian Operators
Ranked by reported flared volume
Figures 8 and 9. permian TOp Operators
by reported flare volume
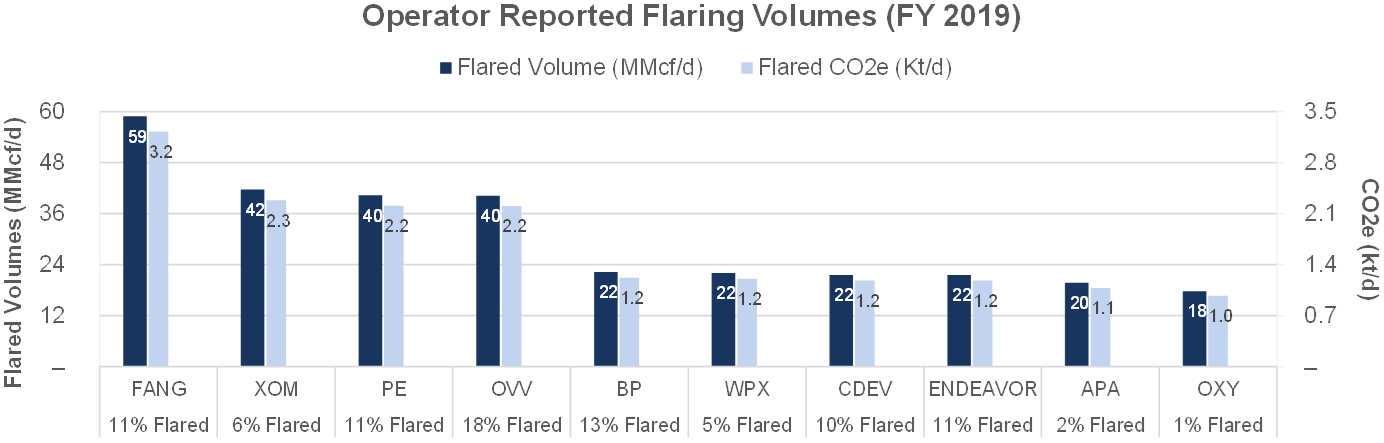
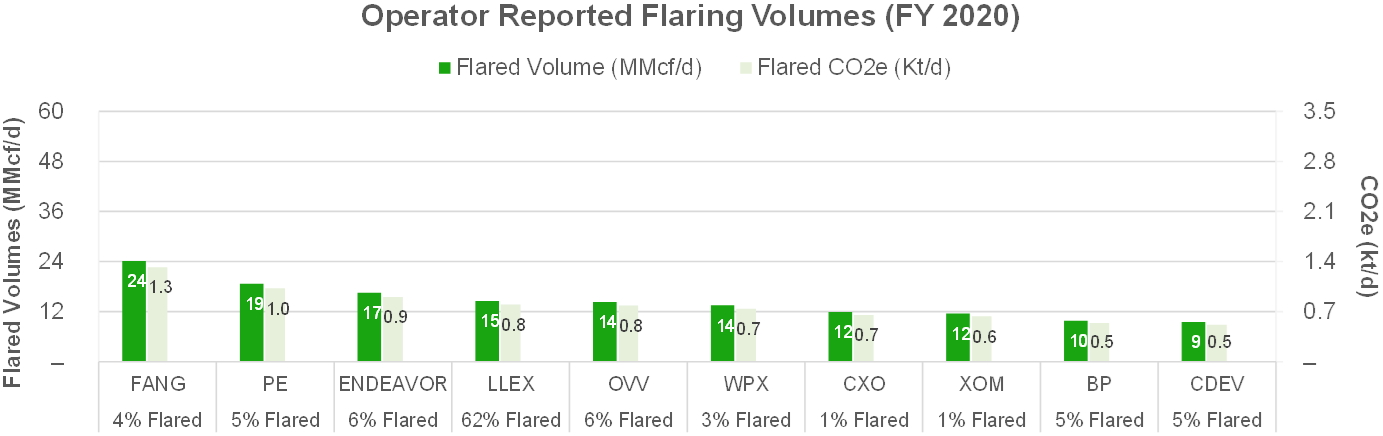
Within the Permian, Operators were ranked by their absolute Flared Percentage for the FY 2019 and FY 2020 periods (See Tables 11 and 12). Lilis Energy (NYSE: LLEX) had the highest Flared Percentage within the Permian in FY 2019 and FY 2020 at 43% and 62%, respectively. (See Tables 11 and 12).
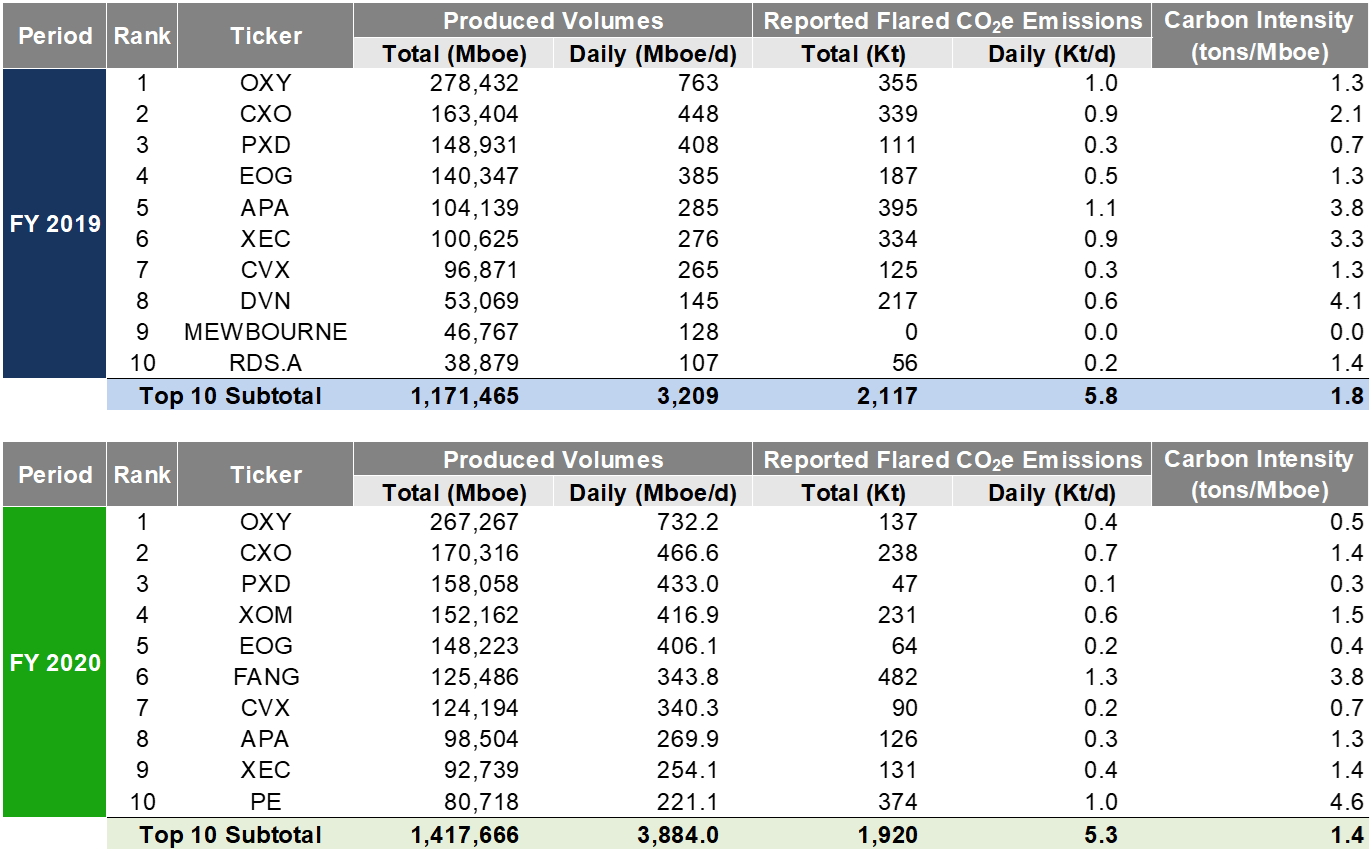
Permian Operators who realized a Flared Percentage of less than 5% were also ranked by their total Produced Volumes (MMcfe). For the FY 2019 and FY 2020 periods, Occidental Petroleum (NYSE: OXY), Concho Resources (NYSE: CXO), and Pioneer Natural Resources (NYSE: PXD) had the highest Produced Volumes while maintaining low Flared Percentages (see Tables 13 and 14).
table 11. Permian Operators Ranked by flared percentage
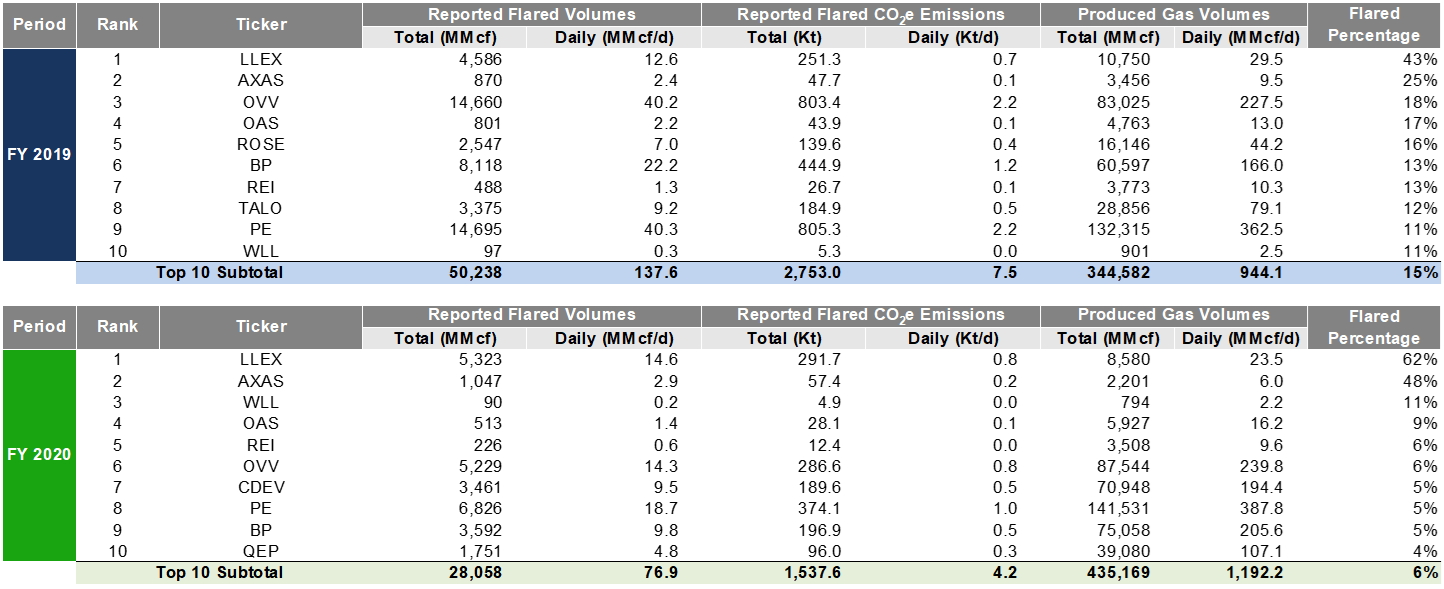
TABLE 12. PERMIAN OPERATORS RANKED BY FLARED PERCENTAGE - FLARING CO2e METRICS
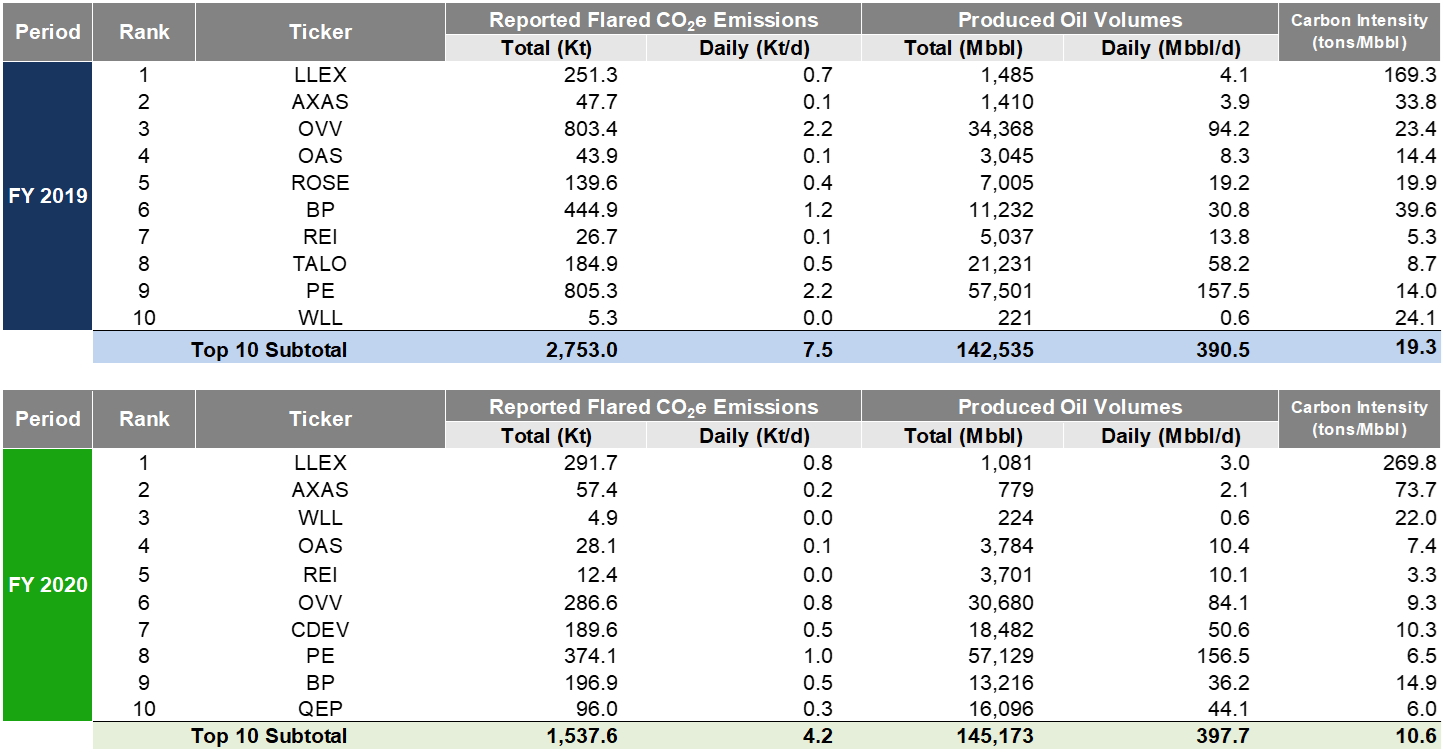
TABLE 13. PERMIAN HIGHEST PRODUCING OPERATORS WITH LOW FLARED PERCENTAGES (<5%)
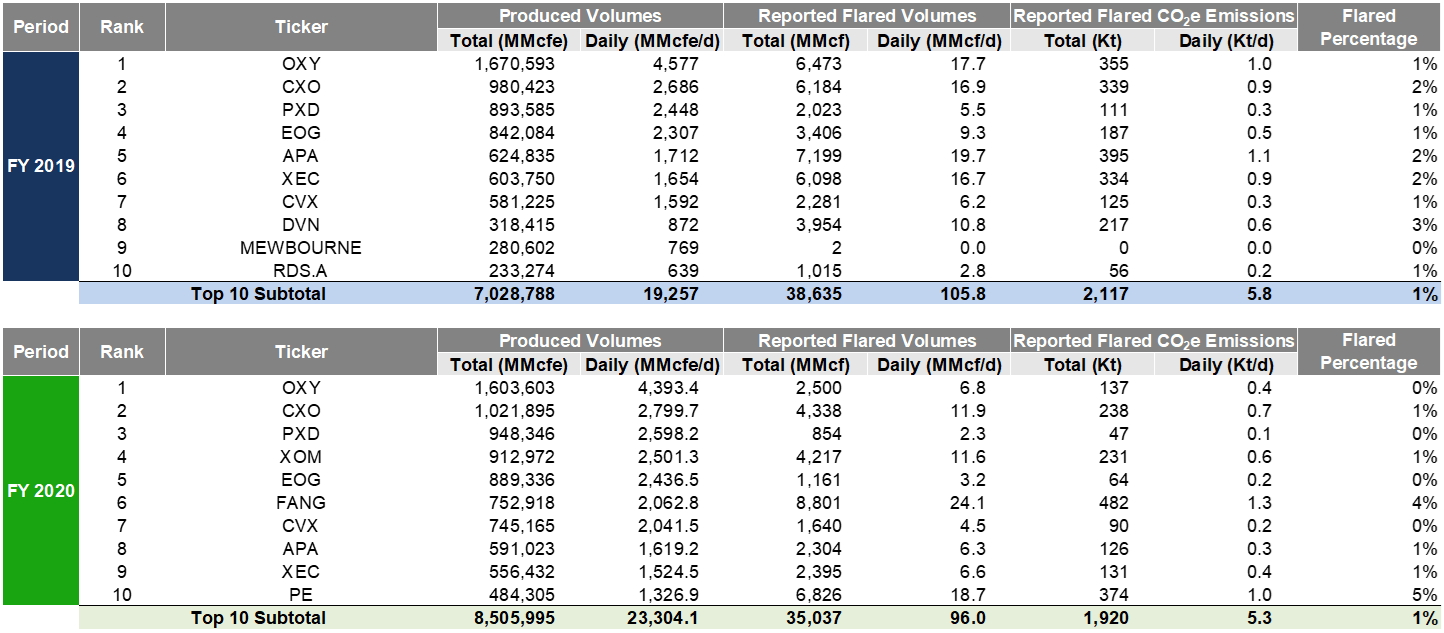
TABLE 14. TRACKED REGION HIGHEST PRODUCING OPERATORS WITH LOW FLARED PERCENTAGES (<5%) – FLARING CO2e METRICS
Bakken
In the Bakken, Reported and Estimated Flare Volumes were 99 / 107 Bcf in FY 2020, reflecting a 52 / 45% drop from the FY 2019 volumes of 205 / 195 Bcf (see Table 15 and Figure 10). On a CO2e basis, Bakken Reported Flaring Volumes were 5 Mt in FY 2020 and 11 Mt in FY 2019.
Within the FY 2019 and FY 2020 periods, peak Reported Flare Volumes and Estimated Flare Volumes were observed in July and March 2019, at 21 Bcf and 23 Bcf, respectively, representing 23% and 26% of total Produced Gas in the region. For the FY 2019 and FY 2020 periods, Reported Flare Volumes reflected, 19% and 10% of total Produced Gas, respectively.
table 15. Bakken Daily Flaring Volumes by Month (Reported Flaring vs. Estimated Flaring)
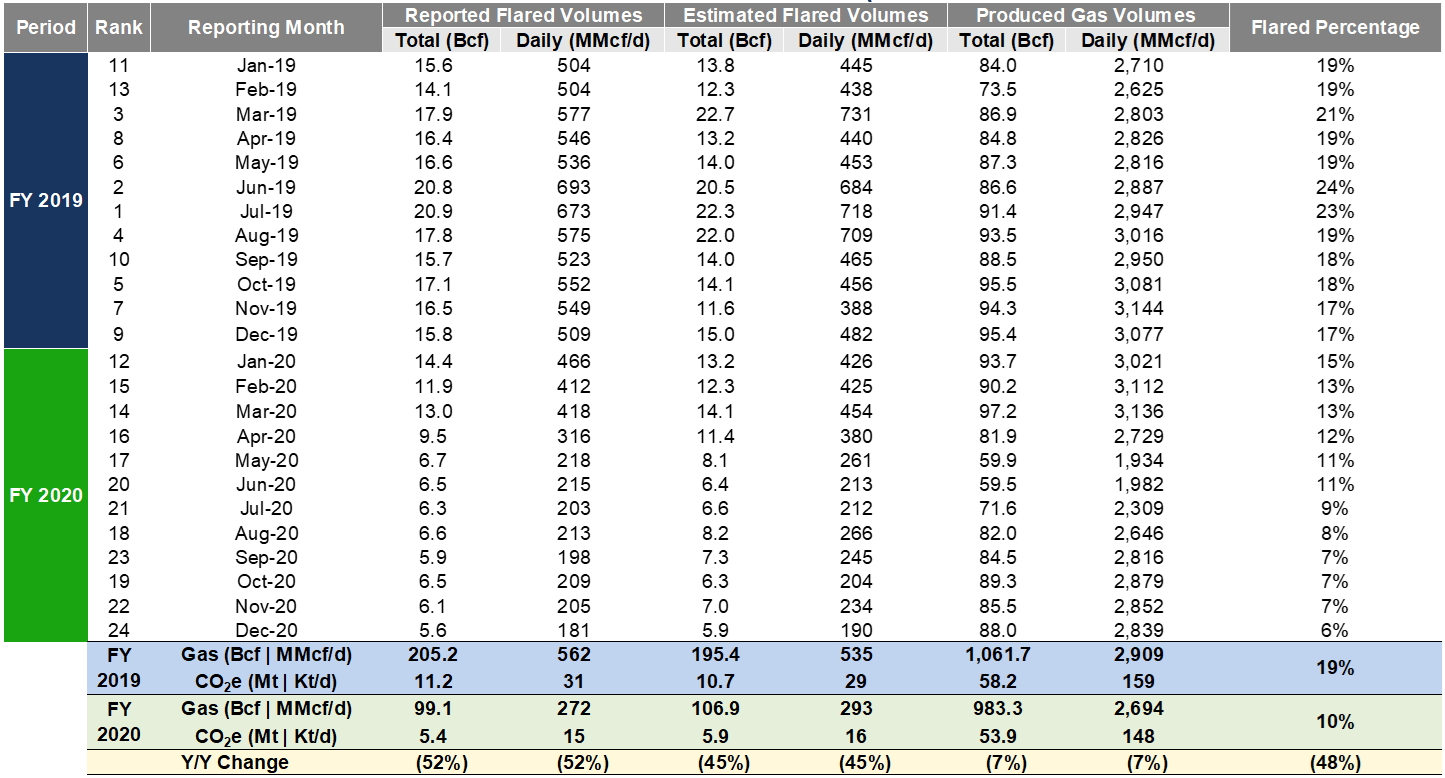
Figure 10. Bakken Daily Flaring Volumes by Month (Reported Flaring vs. Estimated Flaring)
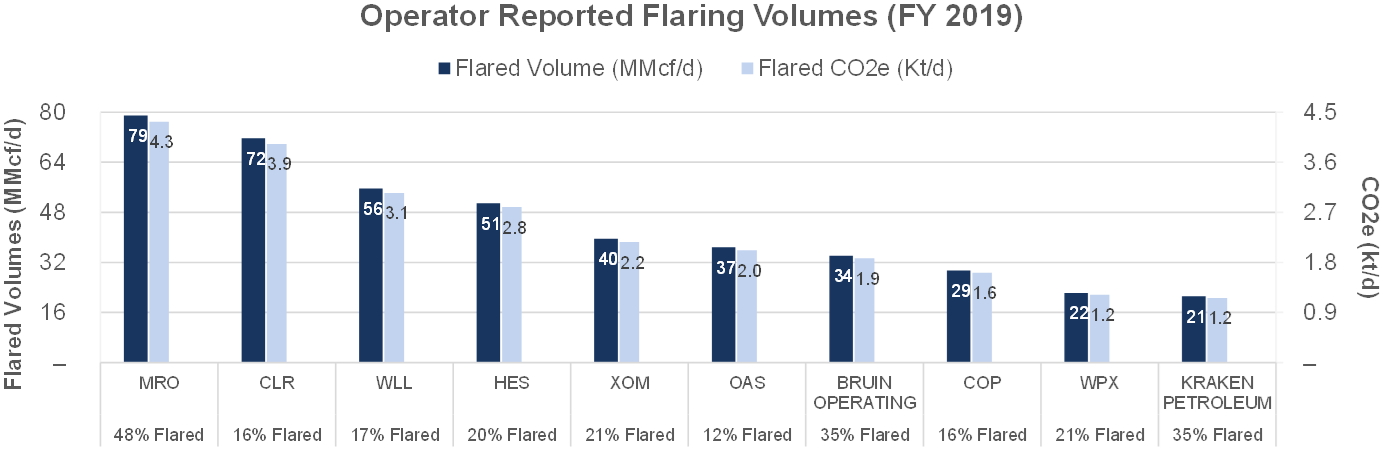
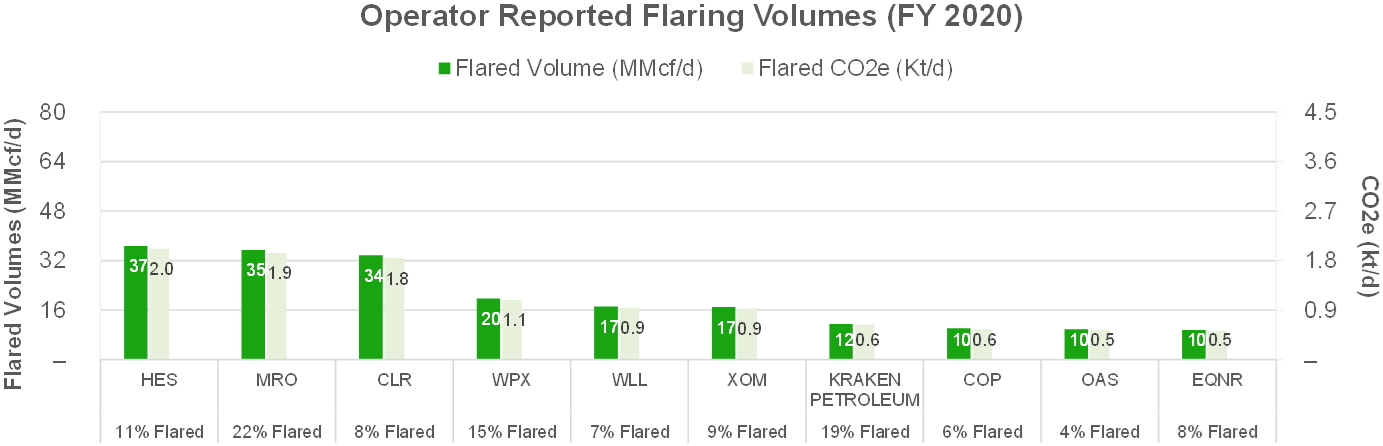
Within the Bakken, Operators were ranked by their absolute Reported Flare Volumes for the FY 2019 and FY 2020 periods (See Table 16 and Figures 11 and 12). Marathon Oil (NYSE: MRO) had the highest average Reported Flare Volumes of 79 MMcf/d for FY 2019 whereas Hess Corporation (NYSE: HES) had the highest volumes of 37 MMcf/d for the FY 2020 period. The Top 10 Operators by Reported Flare Volumes accounted for 78% of the total FY 2019 Bakken Flare Volumes and 74% of the FY 2020 volumes.
table 16. Bakken Operators Ranked by reported flared volume
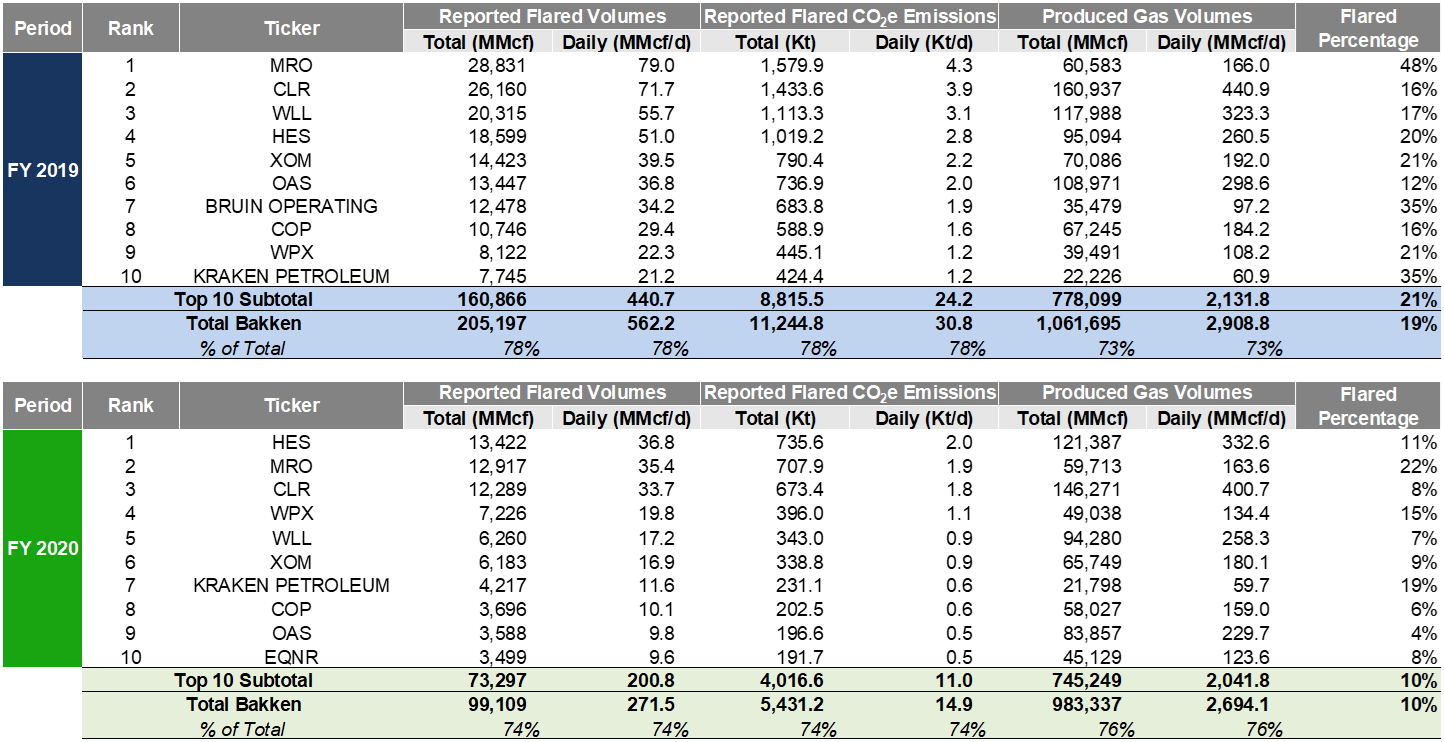
figures 11 and 12. Bakken Operators Ranked by reported flared volume
Within the Bakken, Operators were ranked by their absolute Flared Percentage for the FY 2019 and FY 2020 periods (See Tables 17 and 18). Marathon Oil (NYSE: MRO) in FY 2019 and Denbury Resources (NYSE: DEN) in FY 2020 had the highest Flared Percentage within the Bakken at 48% and 89%, respectively.
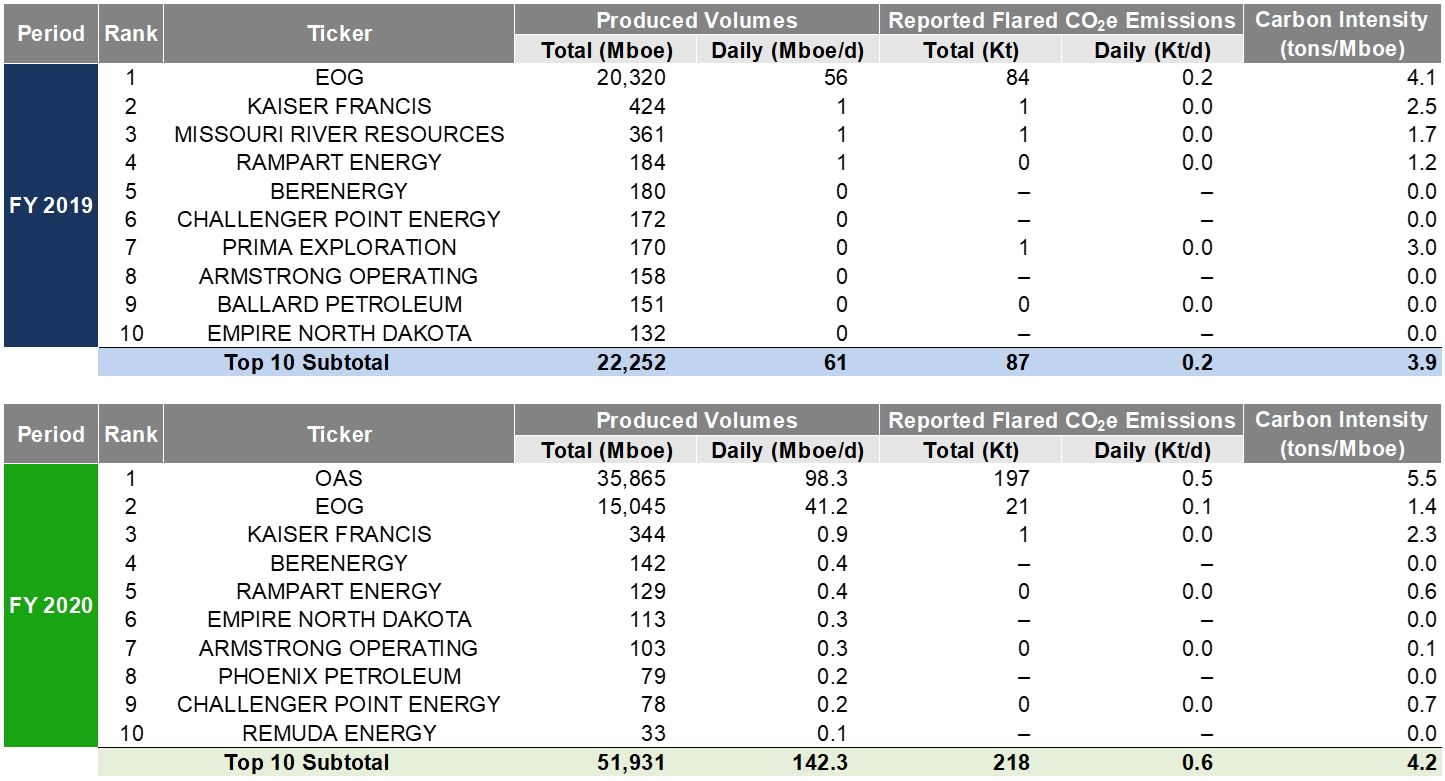
Bakken Operators who realized a Flared Percentage of less than 5% were also ranked by their total Produced Volumes (MMcfe). For the FY 2019 and FY 2020 periods, EOG Resources (NYSE: EOG), Kaiser Francis Operating Company, and Oasis Petroleum (NASDAQ: OAS) had the highest Produced Volumes while maintaining low Flared Percentages (see Tables 19 and 20).
table 17. Bakken Operators Ranked by Flared Percentage
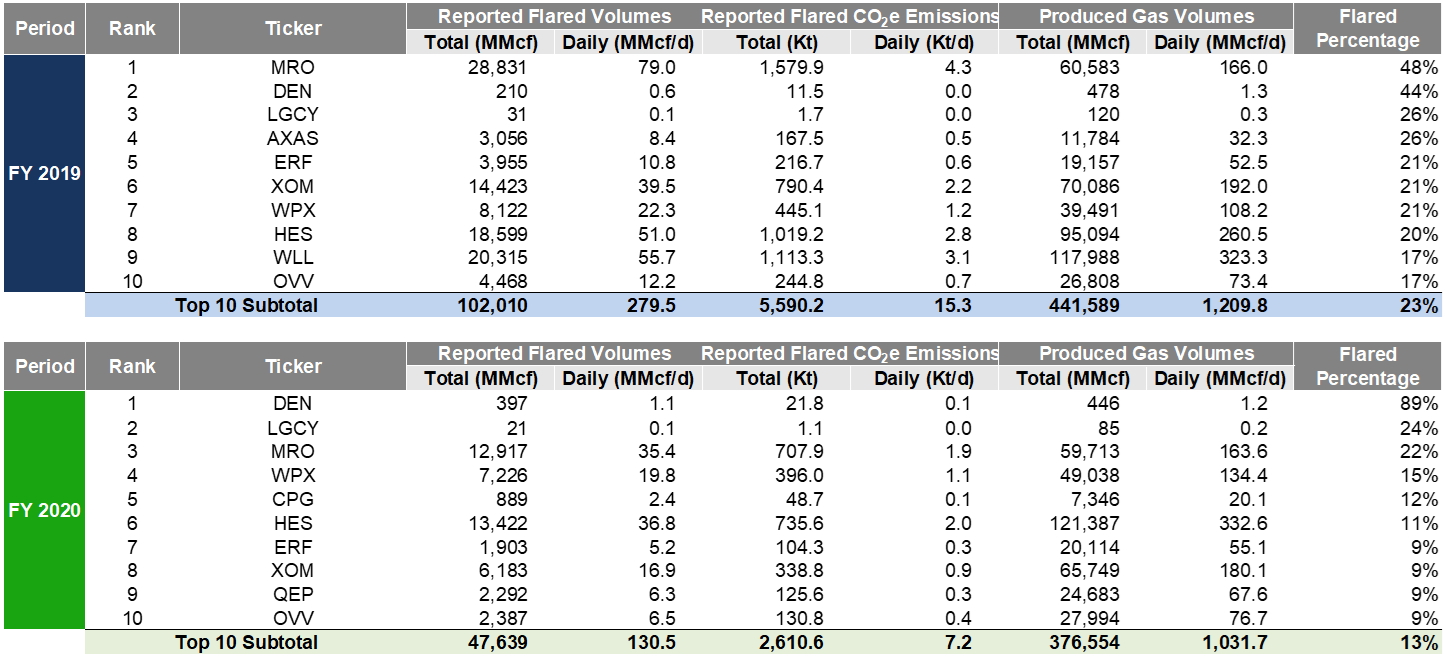
table 18. BAKKEN OPERATORS RANKED BY FLARED PERCENTAGE - FLARING CO2e METRICS
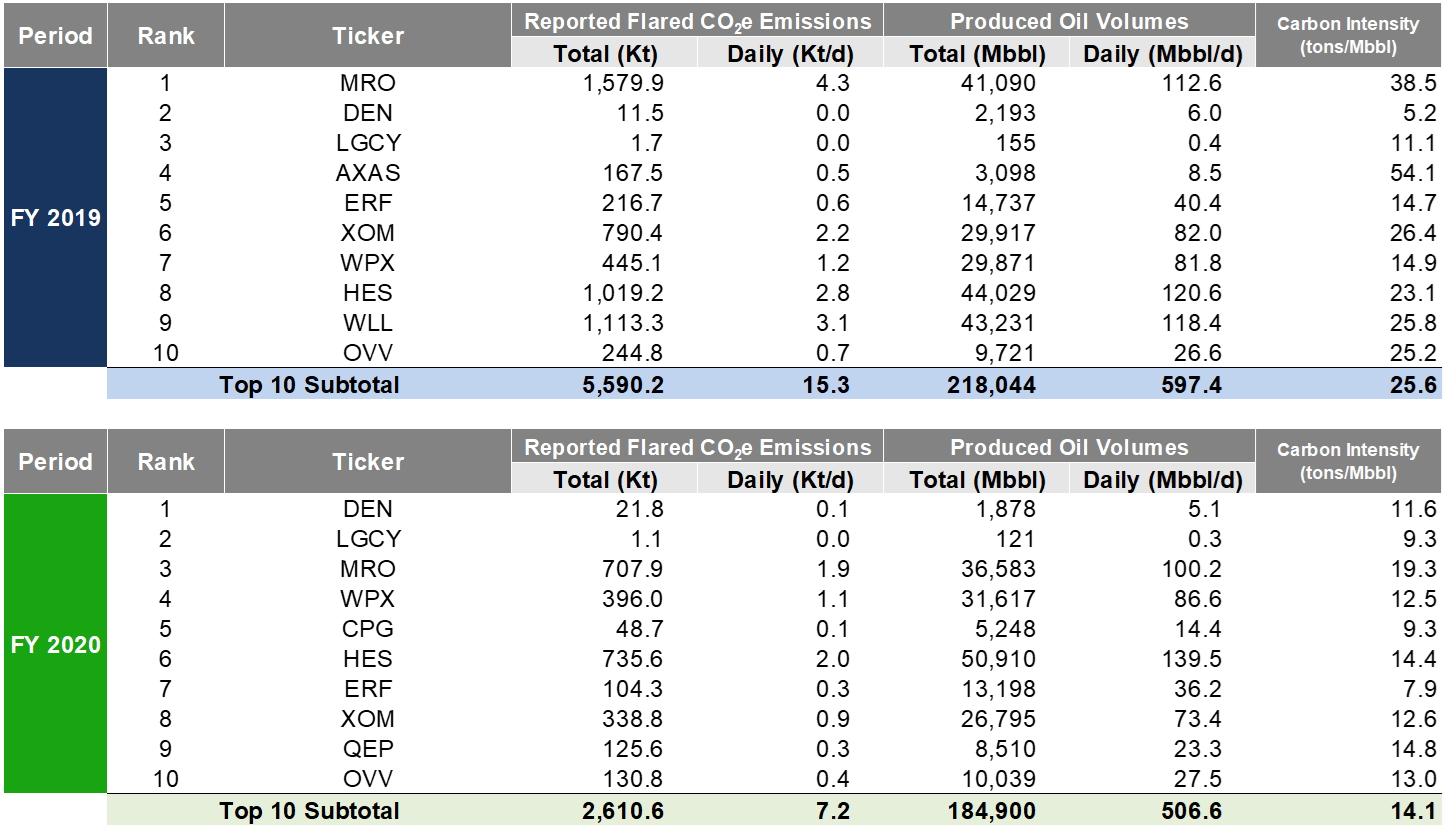
table 19. BAKKEN HIGHEST PRODUCING OPERATORS WITH LOW FLARED PERCENTAGES (<5%)
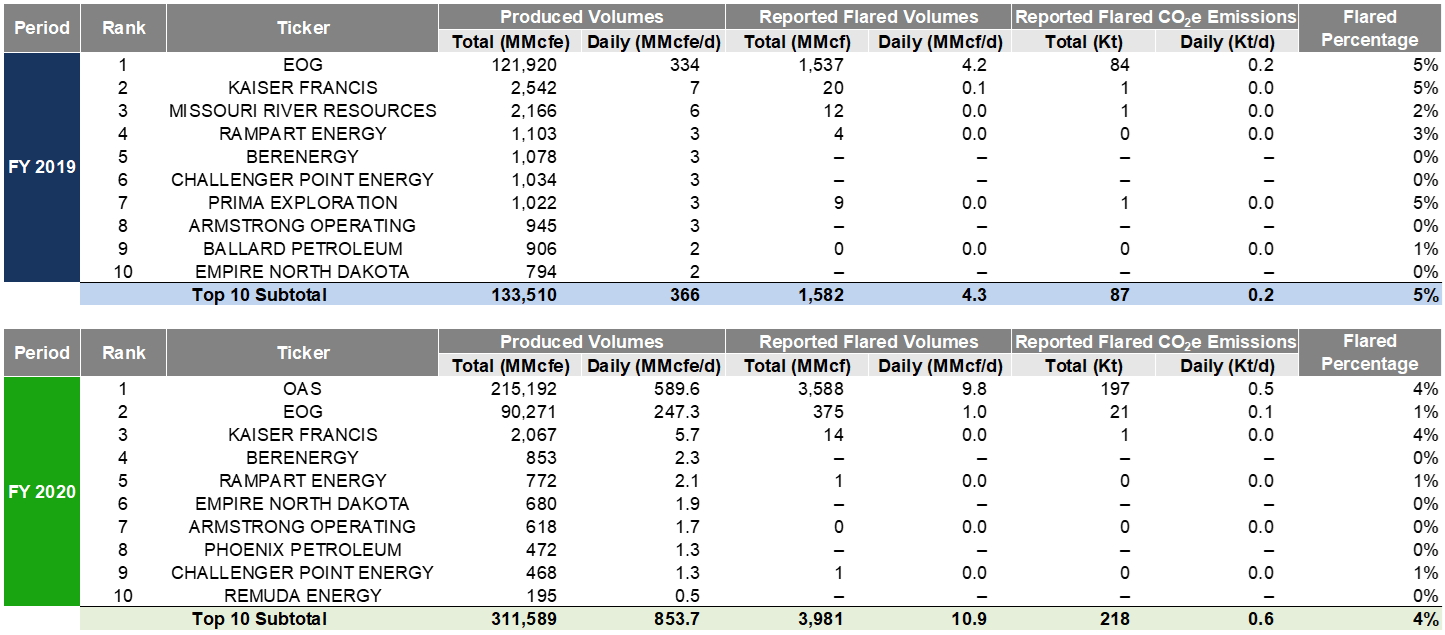
table 20. BAKKEN HIGHEST PRODUCING OPERATORS WITH LOW FLARED PERCENTAGES (<5%) – FLARING CO2e METRICS
Eagle Ford
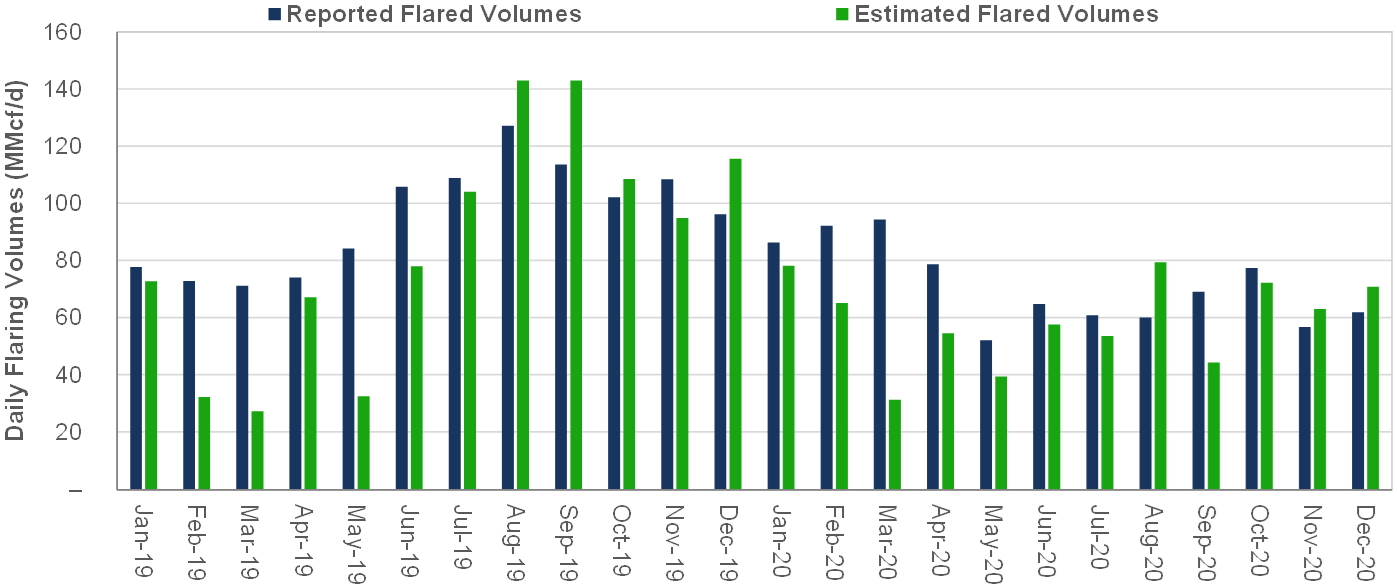
In the Eagle Ford, Reported and Estimated Flare Volumes were 26 / 22 Bcf in FY 2020, reflecting a 25 / 30% drop from the FY 2019 volumes of 35 / 31 Bcf (see Table 21 and Figure 13). On a CO2e basis, Eagle Ford Reported Flaring Volumes were 1 Mt in FY 2020 and 2 Mt in FY 2019.
Within the FY 2019 and FY 2020 periods, peak Reported Flare Volumes and Estimated Flare Volumes were observed in August 2019, at 3.9 Bcf and 4.4 Bcf, respectively, representing ~1.8% of total Produced Gas in the region for the month. For the FY 2019 and FY 2020 periods, Reported Flare Volumes reflected, 1.3% and 1.1%, of total Produced Gas.
table 21. Eagle ford
DAILY FLARING VOLUMES (REPORTED VS. ESTIMATED FLARING)
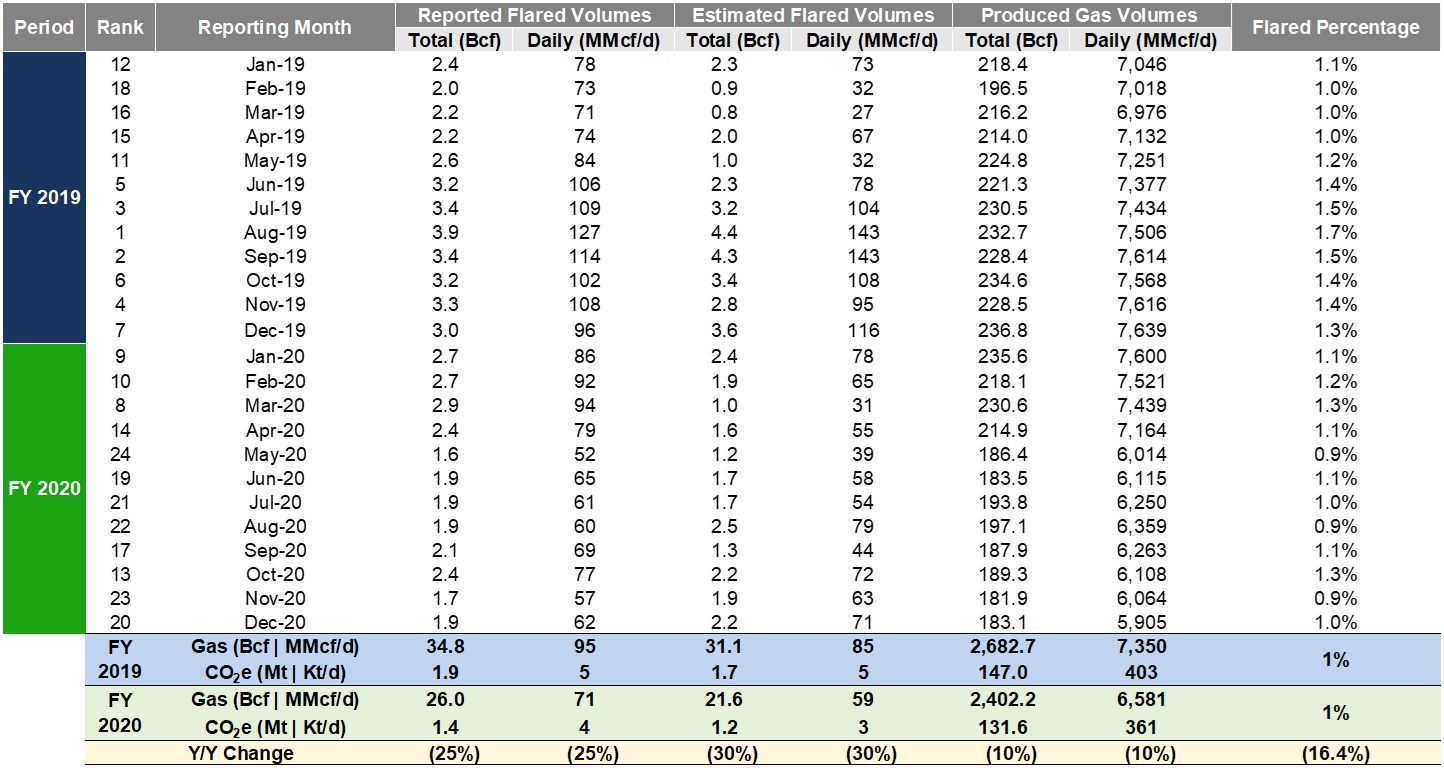
Figure 13. eagle
ford DAILY FLARING VOLUMES (REPORTED VS. ESTIMATED FLARING)
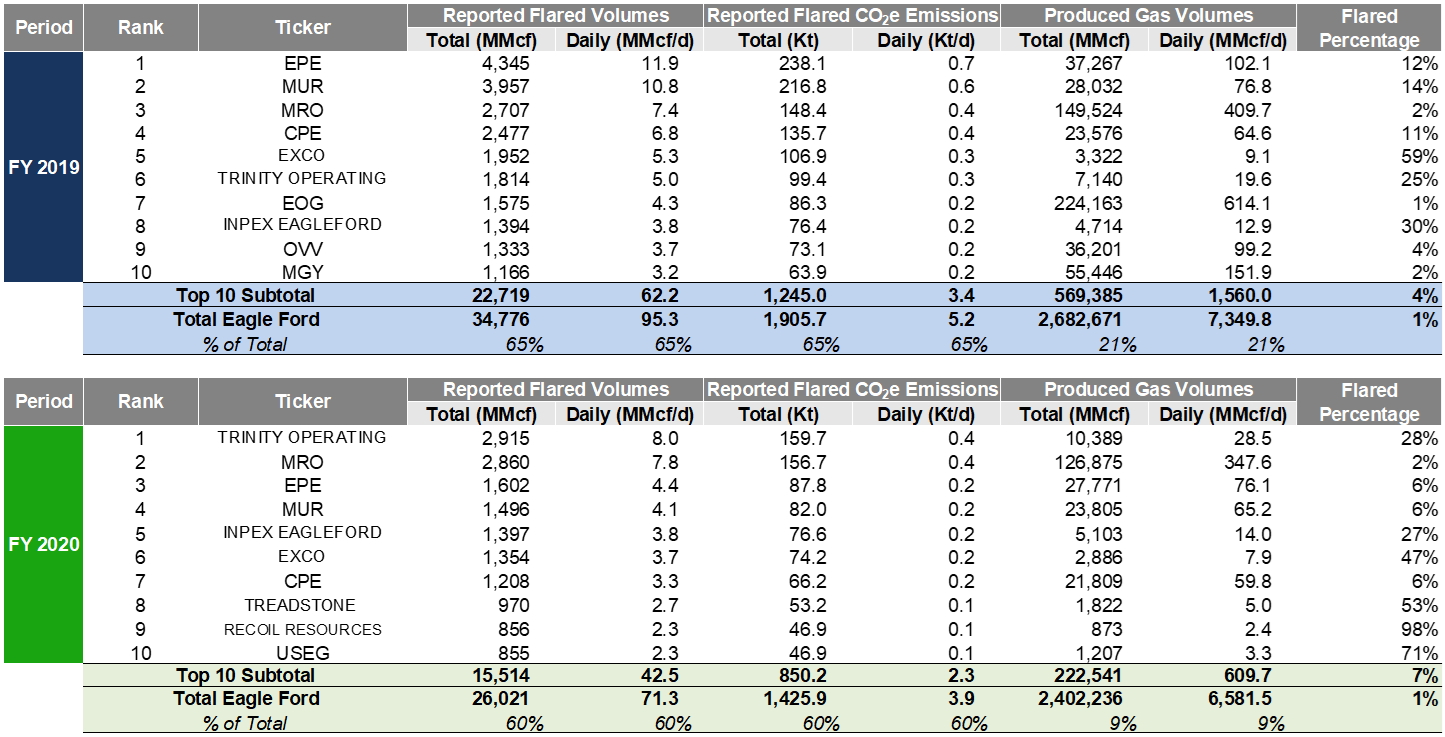
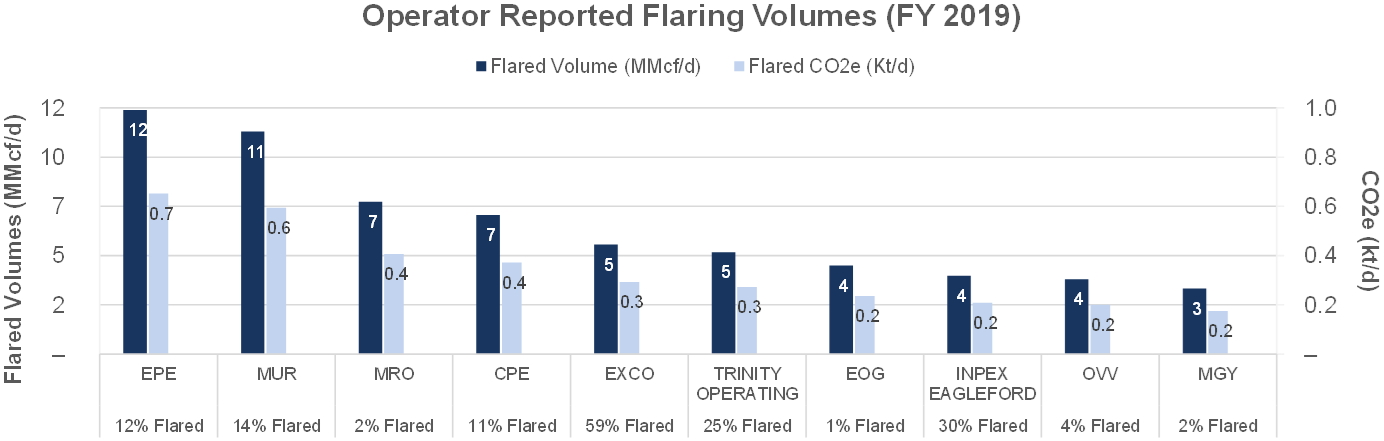
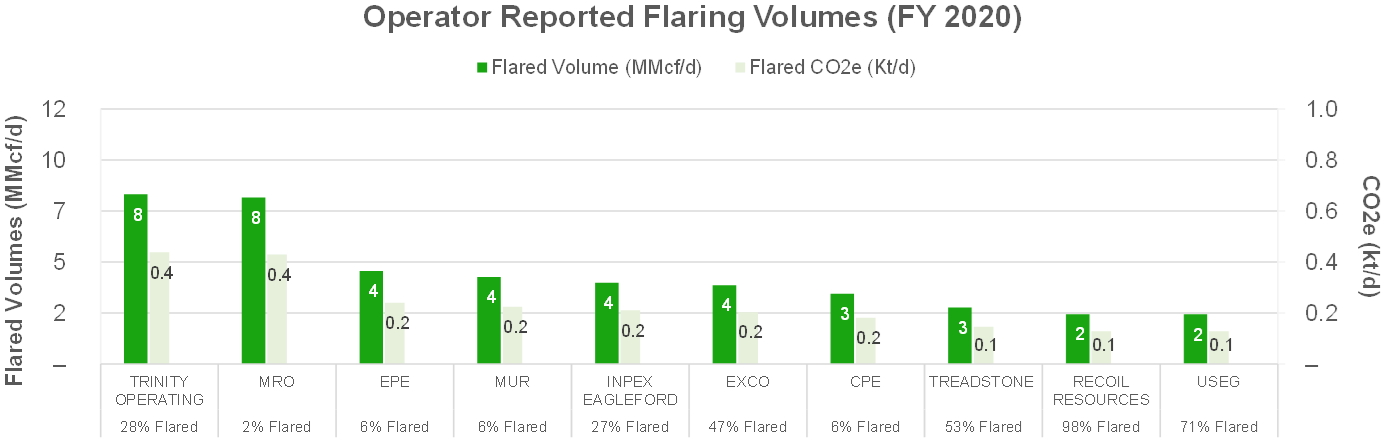
Within the Eagle Ford, Operators were ranked by their absolute Reported Flare Volumes for the FY 2019 and FY 2020 periods (See Table 22 and Figures 14 and 15). EP Energy (NYSE: EPE) had the highest average Reported Flare Volumes of 12 MMcf/d for FY 2019, whereas Trinity Operating, LLC had the highest volumes of 8 MMcf/d for the FY 2020 period. EOG Resources (NYSE: EOG), Ovintiv Inc. (NYSE: OVV) and Magnolia Oil & Gas (NYSE: MGY) were among the top “flarers” by Reported Flare Volumes for the FY 2019 period but were replaced by Treadstone Energy, LLC, Recoil Resources, LLC and U.S. Energy (NYSE: USEG) in the FY 2020 period. The Top 10 Operators by Reported Flare Volumes accounted for 65% of the total FY 2019 Eagle Ford Flare Volumes and 60% of the FY 2020 volumes, while accounting for 9 – 21% of the total Produced Gas Volumes.
table 22. eagle
ford Operators ranked by reported flare volumes
Figures 14 and 15. EAGLE
FORD OPERATORS RANKED BY REPORTED FLARE VOLUMES
Within the Eagle Ford, Operators were ranked by their absolute Flared Percentage for the FY 2019 and FY 2020 periods (See Tables 23 and 24). U.S. Energy (NYSE: USEG) had the highest Flared Percentage within the Eagle Ford in FY 2019 and FY 2020 at 75% and 71%, respectively. (See Tables 23 and 24).
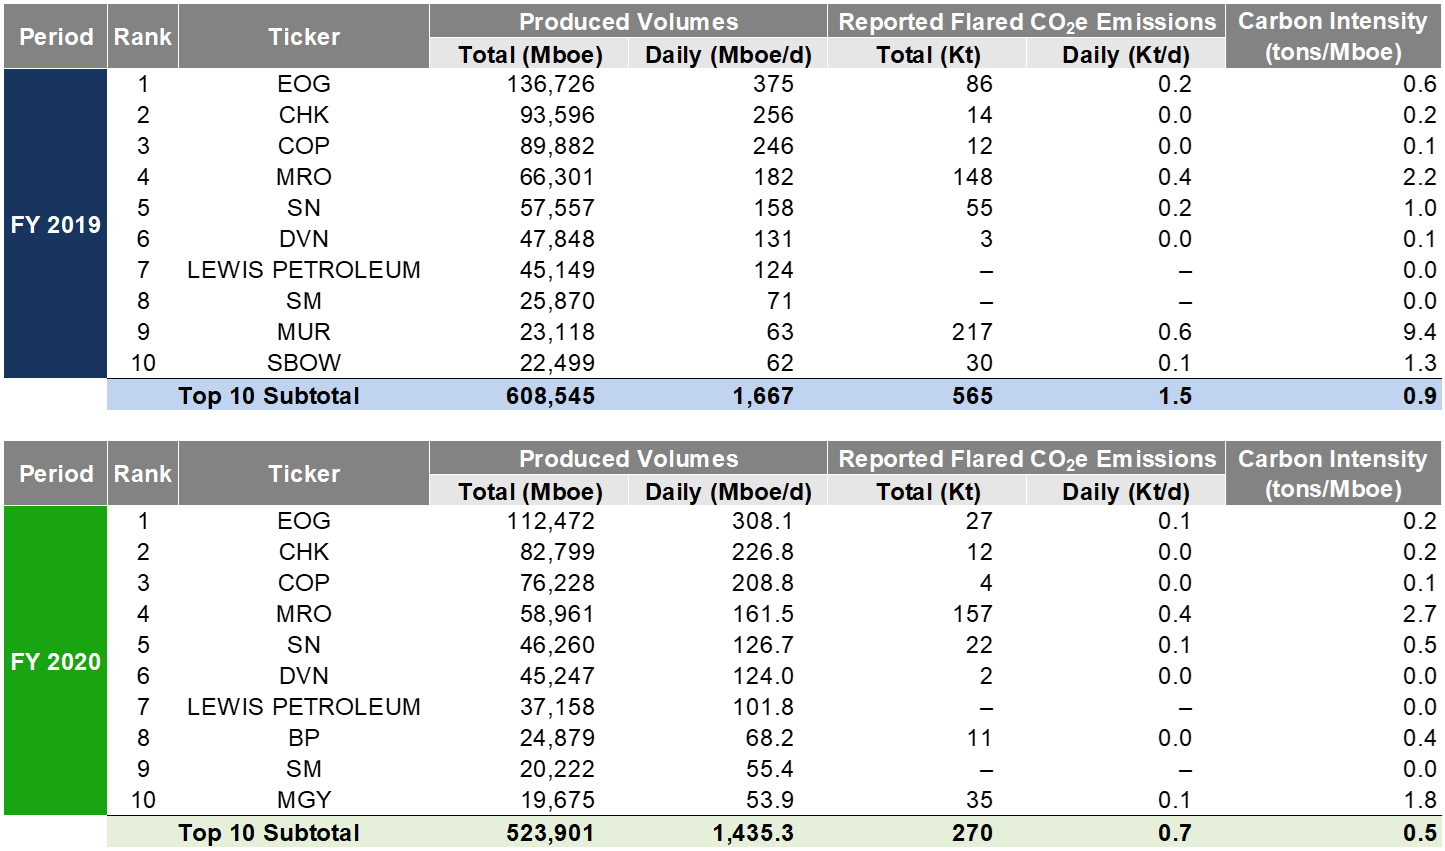
Eagle Ford Operators who realized a Flared Percentage of less than 5% were also ranked by their total Produced Volumes (MMcfe). For the FY 2019 and FY 2020 periods, EOG Resources (NYSE: EOG), Chesapeake Energy (NASDAQ: CHK), and ConocoPhillips (NYSE: COP) had the highest Produced Volumes while maintaining low Flared Percentages (see Tables 25 and 26).
table 23. EAGLE FORD OPERATORS RANKED BY Flared Percentage
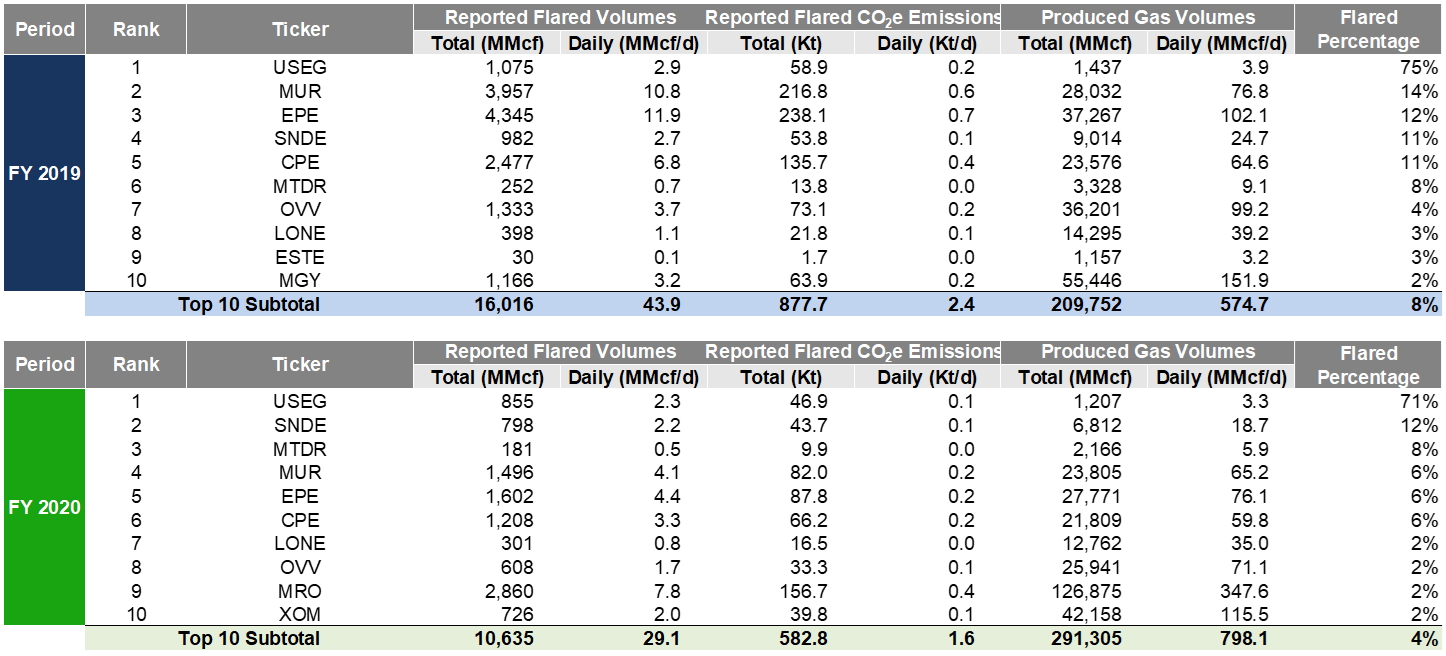
table 24. EAGLE FORD OPERATORS RANKED BY FLARED PERCENTAGE - FLARING CO2e METRICS
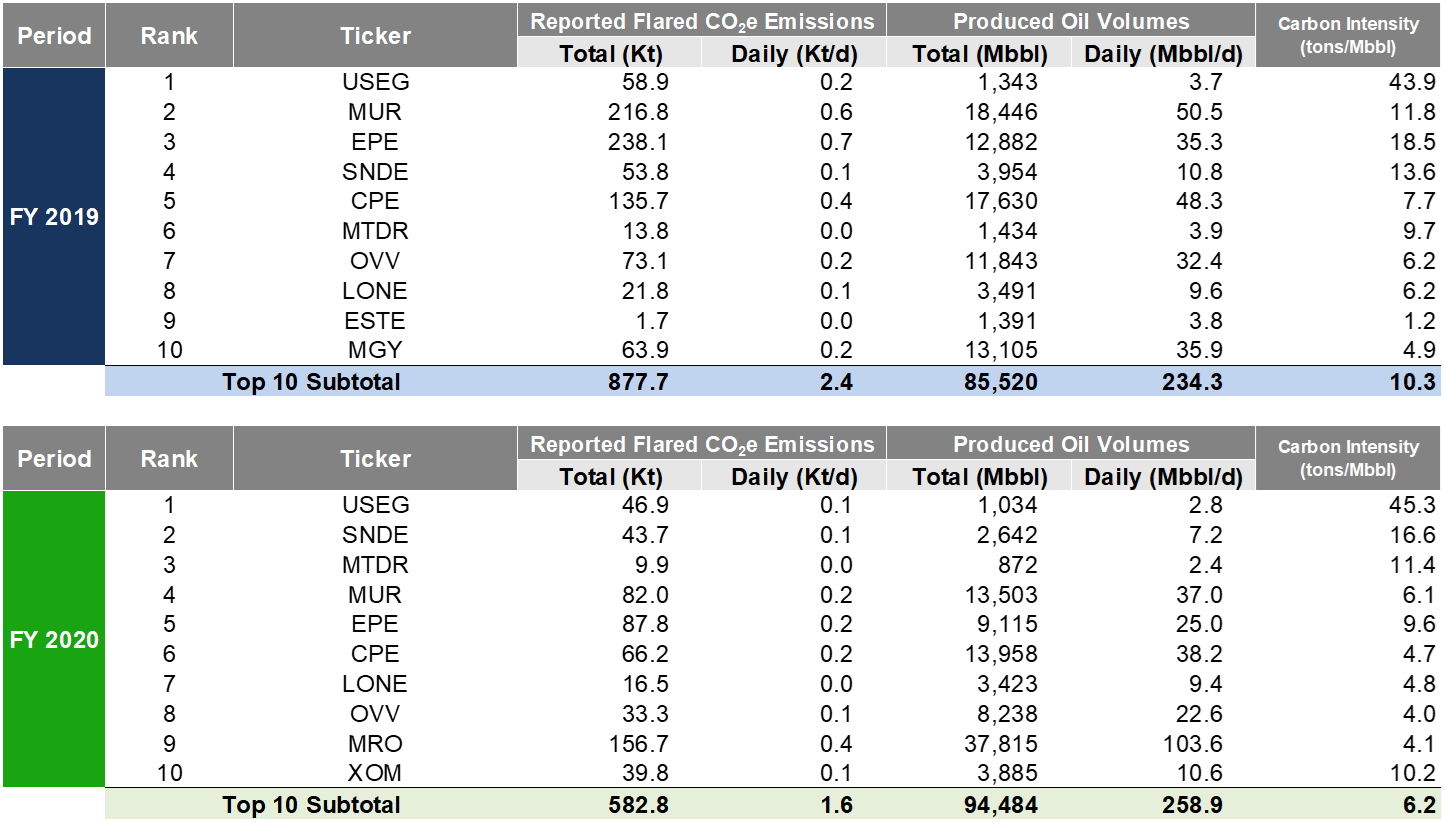
table 25. EAGLE FORD HIGHEST PRODUCING OPERATORS WITH LOW FLARED PERCENTAGES (<5%)
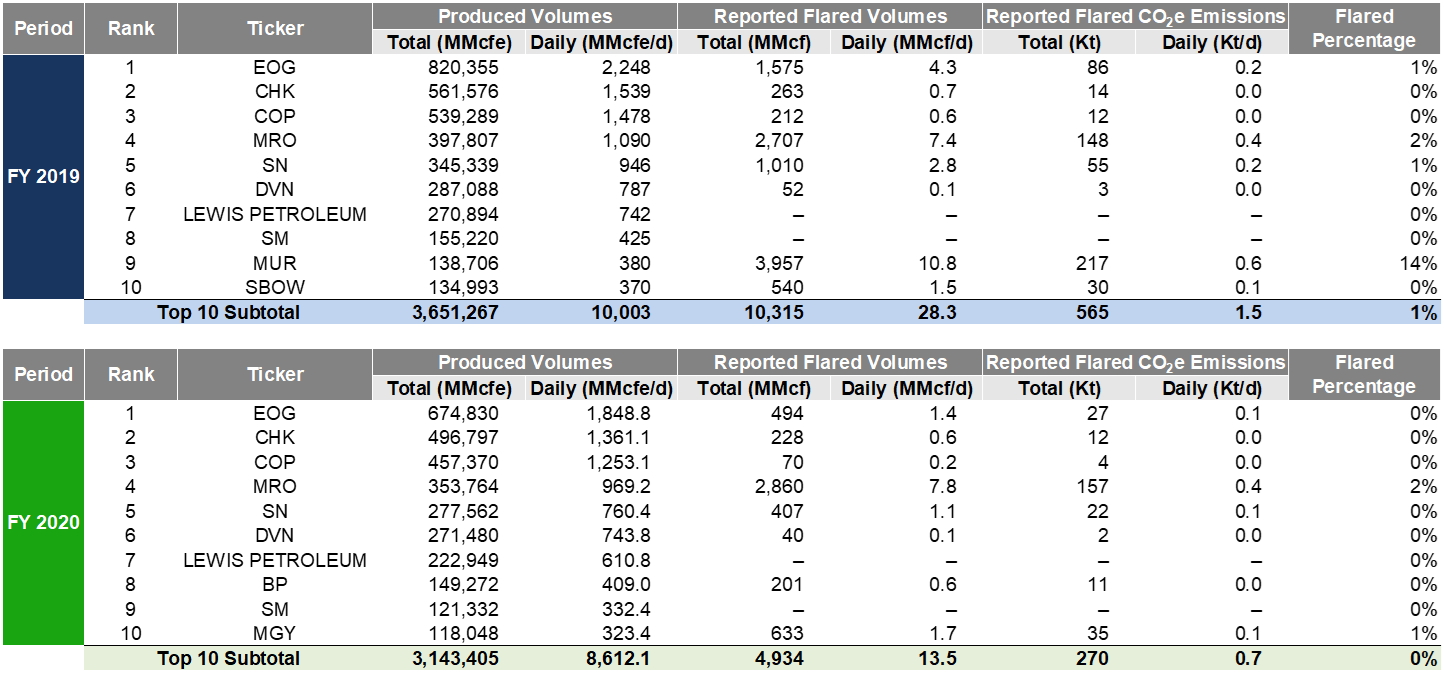
table 26. EAGLE FORD HIGHEST PRODUCING OPERATORS WITH LOW FLARED PERCENTAGES (<5%) – FLARING CO2e METRICS
DJ Basin
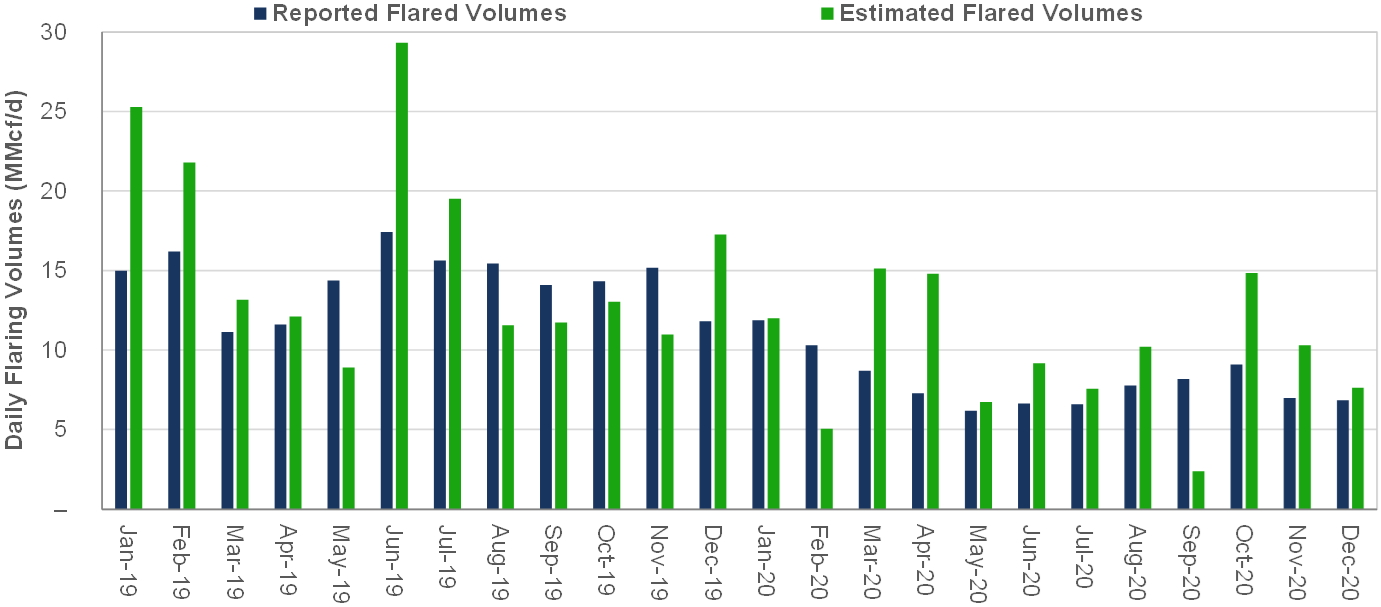
In the DJ Basin, Reported and Estimated Flare Volumes were 2.9 / 3.5 Bcf in FY 2020, reflecting a 44 / 40% drop from the FY 2019 volumes of 5.2 / 5.9 Bcf (see Table 27 and Figure 16). On a CO2e basis, DJ Basin Reported Flaring Volumes were 0.2 Mt in FY 2020 and 0.3 Mt in FY 2019.
Within the FY 2019 and FY 2020 periods, peak Reported Flare Volumes and Estimated Flare Volumes were observed in June 2019, at 0.5 Bcf and 0.9 Bcf, respectively, representing 0.4% and 0.6% of total Produced Gas in the region for the month (see Table 27). For the FY 2019 and FY 2020 periods, Reported Flare Volumes reflected, 0.3% and 0.2%, of total Produced Gas, respectively.
table 27. DJ Basin DAILY FLARING VOLUMES (REPORTED VS. ESTIMATED FLARING)
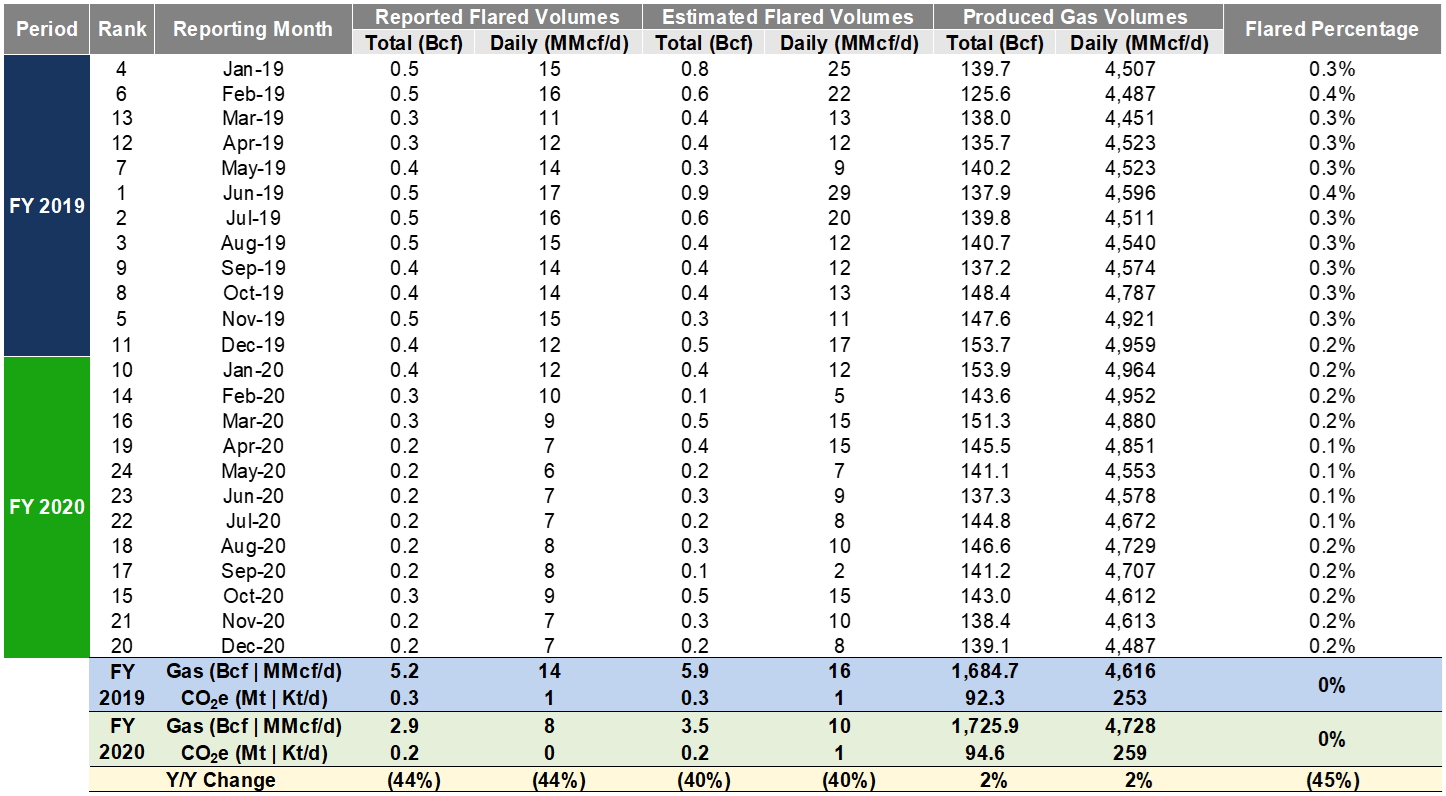
Figure 16. DJ BASIN DAILY FLARING VOLUMES (REPORTED VS. ESTIMATED FLARING)
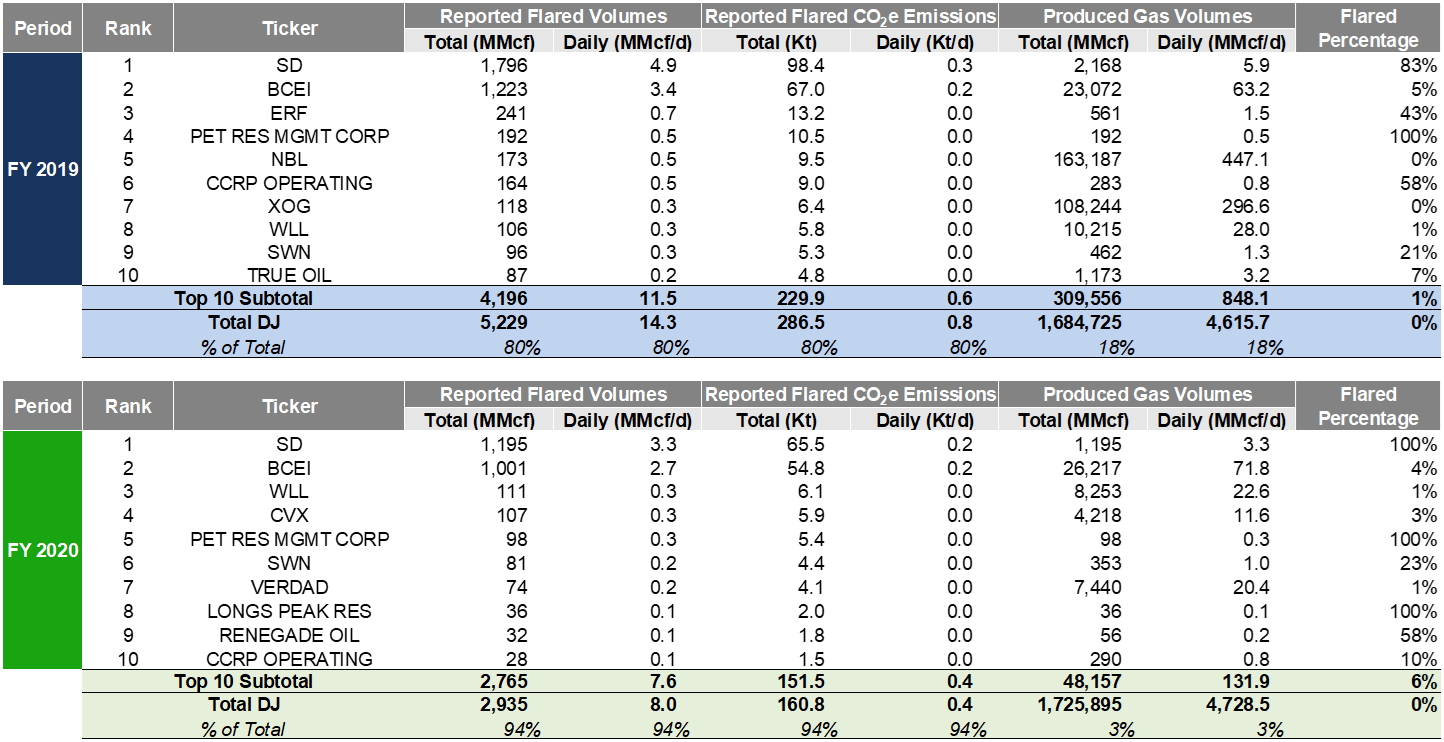
Within the DJ Basin, Operators were ranked by their absolute Reported Flare Volumes for the FY 2019 and FY 2020 periods (See Table 28 and Figures 17 and 18). Sandridge (NYSE: SD) had the highest average Reported Flare Volumes of 4.9 MMcf/d for FY 2019 and of 3.3 MMcf/d for the FY 2020 period. The Top 10 Operators by Reported Flare Volumes accounted for 80% of the total FY 2019 DJ Basin Flare Volumes and 94% of the FY 2020 volumes, while accounting for 3 – 18% of the total Produced Gas Volumes.
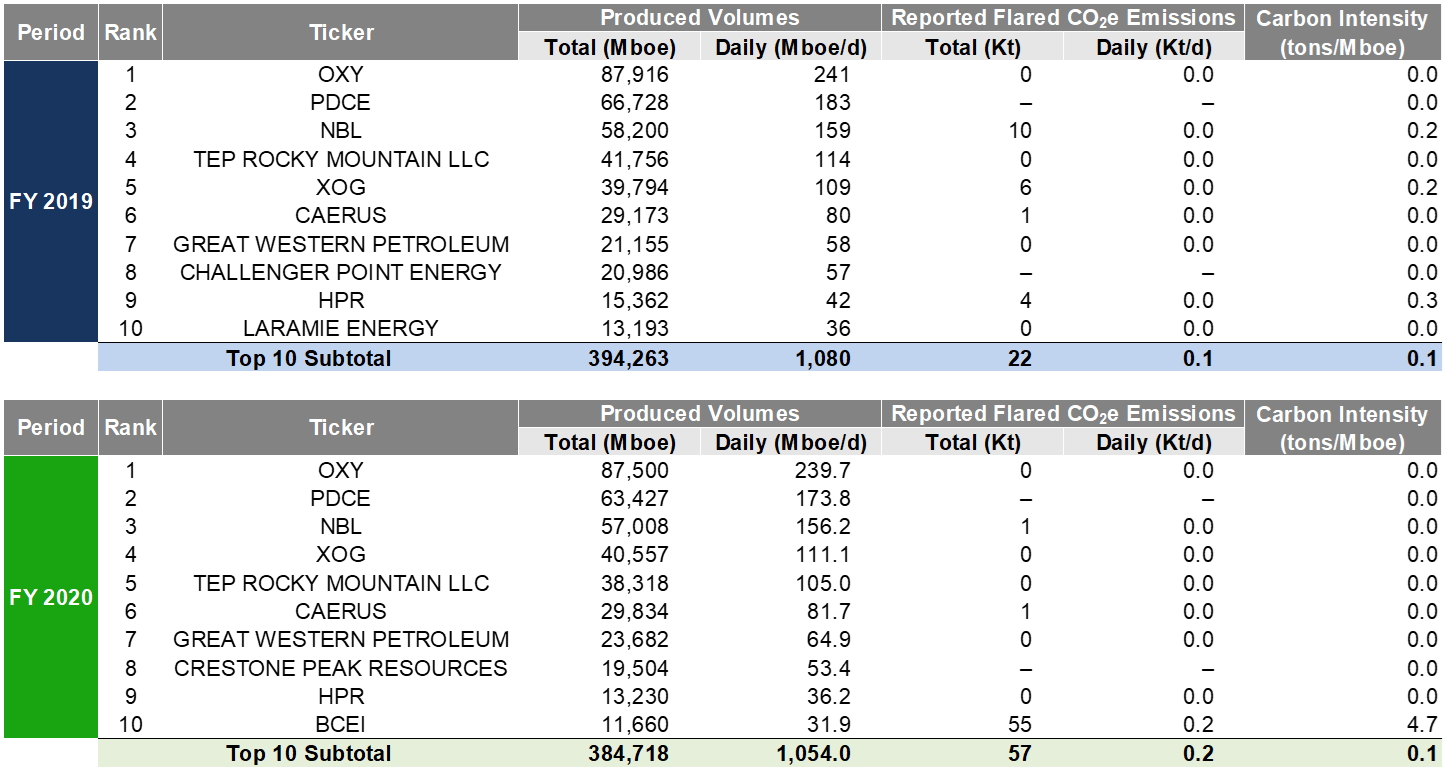
DJ Basin Operators who realized a Flared Percentage of less than 5% were also ranked by their total Produced Volumes (MMcfe). For the FY 2019 and FY 2020 periods, Occidental Resources (NYSE: OXY), PDC Energy (NASDAQ: PDCE), and Noble Energy (NASDAQ: NBL) had the highest Produced Volumes while maintaining low Flared Percentages (see Tables 29 and 30).
Table 28. DJ BASIN OPERATORS RANKED BY REPORTED FLARE VOLUMES
Figures 17 and 18. DJ BASIN OPERATORS RANKED BY REPORTED FLARE VOLUMES
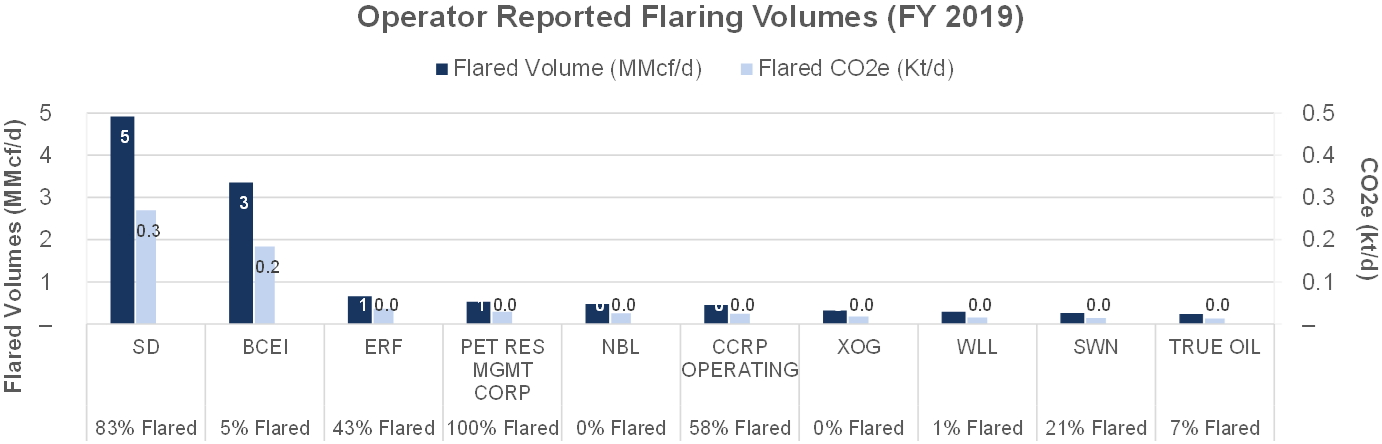
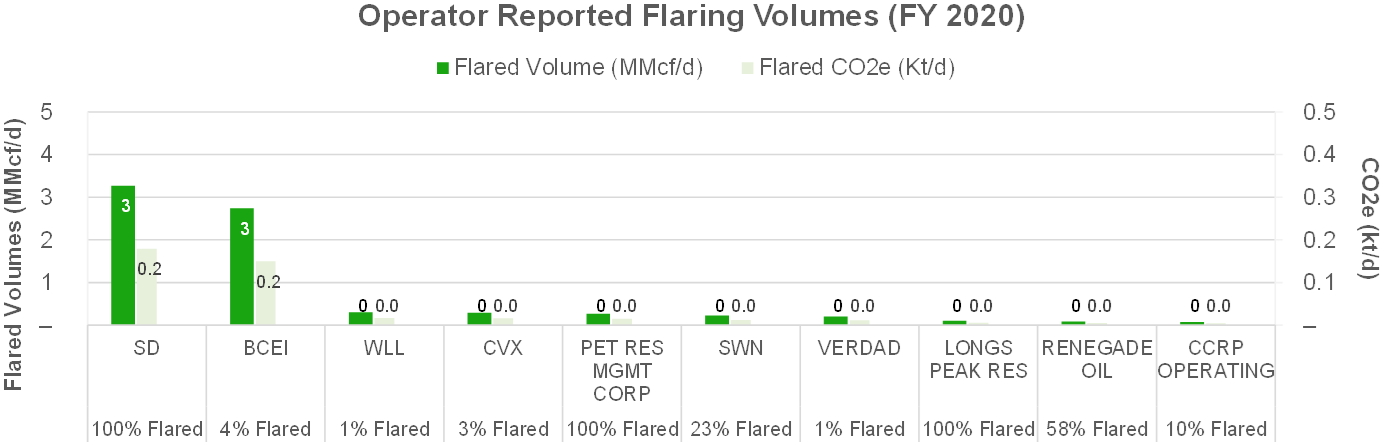
Table 29. DJ BASIN HIGHEST PRODUCING OPERATORS WITH LOW FLARED PERCENTAGES (<5%)
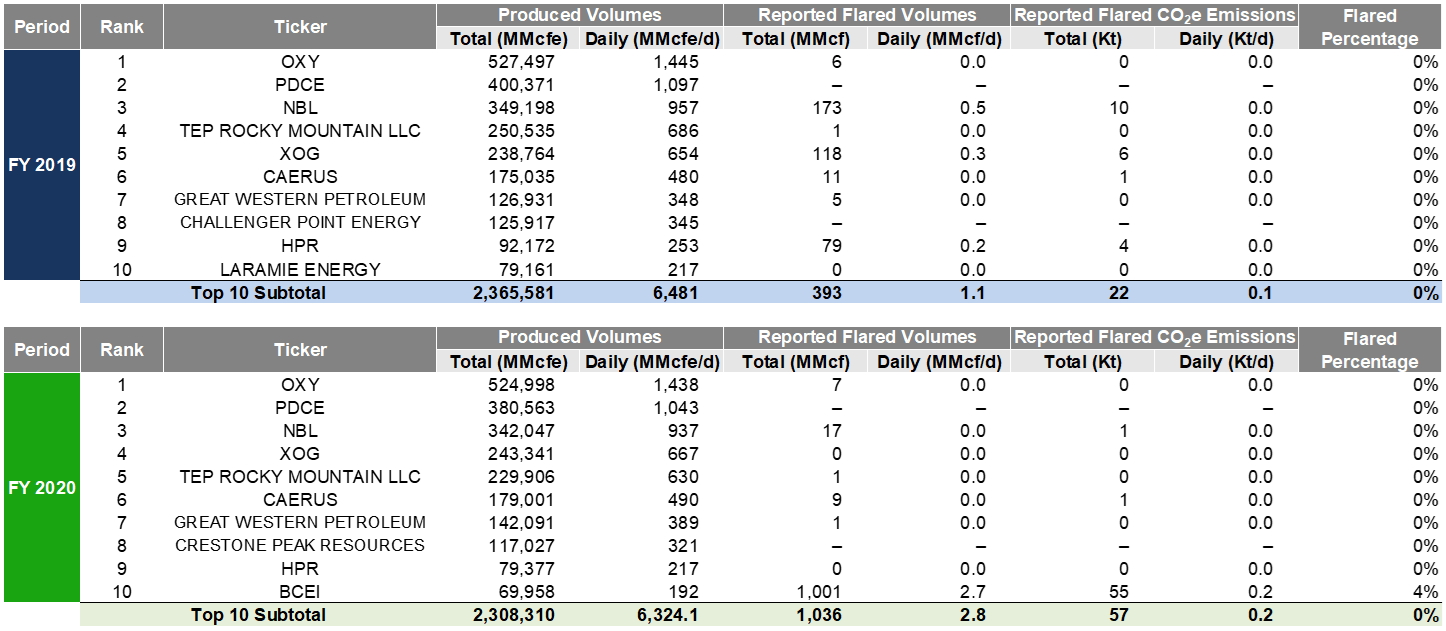
Table 30. EAGLE FORD HIGHEST PRODUCING OPERATORS WITH LOW FLARED PERCENTAGES (<5%) – FLARING CO2e METRICS
Conclusion
Over the last decade, the application of novel hydraulic fracturing techniques to unconventional shale plays has caused U.S. hydrocarbon production to rapidly grow by over 50% since 2010. Coupled with this increase in exploration and production activity, natural gas flaring volumes have also simultaneously risen.
By leveraging publicly available satellite sensor data, the techniques noted within this analysis demonstrate a means of quantifying these flared volumes in near-real time, as an alternative to state-government reported sources. The methodologies outlined offer a systematic and objective means of monitoring flaring activity in aggregate and have the potential to be transferred in other hydrocarbon-producing regions across the world.
From these methods, it is possible to analyze gas flaring activity on a site-specific basis and identify the levels of combustion on a near-real time basis to better inform local communities of the potential health and environmental impacts of flaring in near real time. This tracking of emissions using alternative sources will increase transparency and communication between Operators, governments, and their local communities and constituents.
Going forward, the coupling of Reported and Estimated Flare Volume datasets will enable the energy industry and its stakeholders to better understand emission levels more holistically and to identify where gaps in midstream infrastructure exist. Equipped with these insights, new capital investment and infrastructure can be implemented to ensure a more sustainable future for all.
Summary Observations
· Tracked Regions:
o Estimated Flare Volumes were 253 Bcf in FY 2020, reflecting a 43% drop from the FY 2019 volumes of 447 Bcf.
§ For the FY 2020 and the FY 2019 periods, the Permian had the highest Estimated Flare Volumes of 121 Bcf and 215 Bcf, respectively.
§ By contrast, the DJ Basin had the least Estimated Flare Volumes for the FY 2020 and FY 2019 periods of 3.5 Bcf and 5.9 Bcf, respectively.
o Reporting Flaring Volumes on a CO2e basis were 14 Mt in FY 2020 and 27 Mt in FY 2019.
o Marathon Oil (NYSE: MRO) had the highest average Reported Flare Volumes in FY 2019 and FY 2020 of 94 MMcf/d and 45 MMcf/d, respectively.
o The Top 10 Operators by Reported Flare Volumes accounted for 40 - 44% of the total FY 2019 / 2020 Tracked Region Flare Volumes, while accounting for 16 – 17% of the total Produced Gas Volumes.
o For the FY 2019 and FY 2020 periods, Occidental Petroleum (NYSE: OXY), EOG Resources (NYSE: EOG), ConocoPhillips (NYSE: COP), and ExxonMobil (NYSE: XOM) were the top Tracked Region Operators who had the highest Produced Volumes while maintaining low Flared Percentages (<5%).
· Permian:
o The Permian had the highest Reported Flare Volumes for both the FY 2019 and FY 2020 periods of 244 Bcf and 129 Bcf, respectively
§ Reported Flaring Volumes on a CO2e basis were 7 Mt in FY 2020 and 13 Mt in FY 2019.
o In the Permian, Diamondback Energy (NYSE: FANG) had the highest average daily Reported Flare Volumes in FY 2019 and FY 2020 of 59 MMcf/d and 24 MMcf/d, respectively.
o The Delaware sub-basin had the highest daily Reported Flare Volume in FY 2019 and FY 2020 of 370 MMcf/d and 193 MMcf/d, respectively.
o For the FY 2019 and FY 2020 periods, Occidental Petroleum (NYSE: OXY), Concho Resources (NYSE: CXO), and Pioneer Natural Resources (NYSE: PXD) were the top Permian Operators who had the highest Produced Volumes while maintaining low Flared Percentages (<5%).
· Bakken:
o The Bakken had the second highest Reported Flare Volumes for both the FY 2019 and FY 2020 periods of 205 Bcf and 99 Bcf, respectively
§ Reported Flaring Volumes on a CO2e basis were 5 Mt in FY 2020 and 11 Mt in FY 2019.
o In the Bakken, Marathon Oil (NYSE: MRO) had the highest average Reported Flare Volumes of 79 MMcf/d for FY 2019 whereas Hess Corporation (NYSE: HES) had the highest volumes of 37 MMcf/d for the FY 2020 period.
o For the FY 2019 and FY 2020 periods, were also ranked by their total Produced Volumes (MMcfe). For the FY 2019 and FY 2020 periods, EOG Resources (NYSE: EOG), Kaiser Francis Operating Company, and Oasis Petroleum (NASDAQ: OAS) were the top Bakken Operators who had the highest Produced Volumes while maintaining low Flared Percentages (<5%).
· Eagle Ford:
o On a CO2e basis, Eagle Ford Reported Flaring Volumes were 1 Mt in FY 2020 and 2 Mt in FY 2019.
o EP Energy (NYSE: EPE) had the highest average Reported Flare Volumes of 12 MMcf/d for FY 2019 whereas Trinity Operating, LLC had the highest volumes of 8 MMcf/d for the FY 2020 period.
o The Top 10 Operators by Reported Flare Volumes accounted for 65% of the total FY 2019 Eagle Ford Flare Volumes and 60% of the FY 2020 volumes, while accounting for 9 – 21% of the total Produced Gas Volumes.
o For the FY 2019 and FY 2020 periods, EOG Resources (NYSE: EOG), Chesapeake Energy (NASDAQ: CHK), and ConocoPhillips (NYSE: COP) were the top Eagle Ford Operators who had the highest Produced Volumes while maintaining low Flared Percentages (<5%).
· DJ Basin:
o The DJ Basin consistently had the lowest Reported Flare Volumes for both the FY 2019 and FY 2020 periods
§ Reported Flaring Volumes on a CO2e basis were 0.2 Mt in FY 2020 and 0.3 Mt in FY 2019.
o In the DJ Basin, Sandridge (NYSE:SD) had the highest average Reported Flare Volumes of 4.9 MMcf/d for FY 2019 and 3.3 MMcf/d for the FY 2020 period.
o For the FY 2019 and FY 2020 periods, Occidental Resources (NYSE: OXY), PDC Energy (NASDAQ: PDCE), and Noble Energy (NASDAQ: NBL) were the top DJ Basin Operators who had the highest Produced Volumes while maintaining low Flared Percentages (<5%).
Source code and data for this process is available under the LGPL open source license in the Github Repository for Flaring Monitor.
References
1. The World Bank (n.d.). Zero Routine Flaring by 2030, from https://www.worldbank.org/en/programs/zero-routine-flaring-by-2030, April 2015.
2. Katherine Ann Willyard, Gunnar W. Schade, Flaring in two Texas shale areas: Comparison of bottom-up with top-down volume estimates for 2012 to 2015, Science of The Total Environment, Volume 691, 2019, Pages 243-251
3. Elvidge, C.D.; Zhizhin, M.; Hsu, F.-C.; Baugh, K.E. VIIRS Nightfire: Satellite Pyrometry at Night. Remote Sens. 2013, 5, 4423-4449. https://doi.org/10.3390/rs5094423
4. Elvidge, C.D.; Zhizhin, M.; Baugh, K.; Hsu, F.-C.; Ghosh, T. Methods for Global Survey of Natural Gas Flaring from Visible Infrared Imaging Radiometer Suite Data. Energies 2016, 9, 14. https://doi.org/10.3390/en9010014
5. VIIRS Nightfire (VNF). (2020, November 16). Retrieved March 30, 2021, from https://payneinstitute.mines.edu/eog/viirs-nightfire-vnf/
6. Maps: Oil and gas Exploration, resources, and production - Energy Information Administration. (n.d.). Retrieved March 30, 2021, from https://www.eia.gov/maps/maps.htm
7. Planet Labs Inc. (n.d.). Retrieved March 30, 2021, from http://www.planet.com/
8. Suomi NPP Visible infrared IMAGING RADIOMETER Suite (VIIRS). (n.d.). Retrieved March 30, 2021, from https://ncc.nesdis.noaa.gov/VIIRS/
9. Commodity.IO LLC (n.d.). Retrieved March 30, 2021, from https://www.commodity.io/
10. Texas Railroad Commission (TX RRC). (n.d.). Retrieved March 30, 2021, from https://www.rrc.state.tx.us/
11. New Mexico Oil Conservation Division (NM OCD). (n.d.). Retrieved March 30, 2021, from http://www.emnrd.state.nm.us/OCD/ocdonline.html
12. North Dakota Industrial Commission (NDIC). (n.d.). Retrieved March 30, 2021, from https://www.dmr.nd.gov/oilgas/
13. Colorado Oil and Gas Conservation Commission. (n.d.). Colorado Oil and Gas Conservation Commission (COGCC). Retrieved March 30, 2021, from https://cogcc.state.co.us/#/home
14. Environmental Protection Agency. (2021, March 11). Greenhouse Gases Equivalencies Calculator - Calculations and References. EPA. https://www.epa.gov/energy/greenhouse-gases-equivalencies-calculator-calculations-and-references